


4.3. Sky Coverage
The final RBGS covered all of the sky surveyed by IRAS except for
a thin strip within |b| < 5 degrees of the Galactic Plane.
Figure 5 displays a
Hammer-Aitoff projection in Galactic coordinates of all source positions
in the RBGS. Also indicated in Figure 5 are
three small regions suffering
heavy contamination from nearby Galactic molecular clouds (Orion:
5h0m < R.A. <
6h40m, -20° < b < -10°;
Ophiuchus: 16h15m < R.A.
< 16h30m,-26°
<  < -20°)
and an area of confusion near the Large Magallenic Cloud (LMC:
5h01m < R.A.
< 6h11m,
-72°45' < <
-66°45'). These three regions were excluded from the
BGS2 (see Figure 1 of
Sanders et al. 1995).
However, with the more thorough data
processing carried out for the RBGS, and the fact that the aerial density
of sources in these regions is not significantly different from regions
of high Galactic latitude, we now believe that most if not all IRAS
bright galaxies within these regions have been identified. Sources that
lie within these regions are included in
Table 1 along with a flag
(an asterisk following the IRAS source name in Column 2)
indicating that they are located in a region of high Galactic foreground
confusion.
< -20°)
and an area of confusion near the Large Magallenic Cloud (LMC:
5h01m < R.A.
< 6h11m,
-72°45' < <
-66°45'). These three regions were excluded from the
BGS2 (see Figure 1 of
Sanders et al. 1995).
However, with the more thorough data
processing carried out for the RBGS, and the fact that the aerial density
of sources in these regions is not significantly different from regions
of high Galactic latitude, we now believe that most if not all IRAS
bright galaxies within these regions have been identified. Sources that
lie within these regions are included in
Table 1 along with a flag
(an asterisk following the IRAS source name in Column 2)
indicating that they are located in a region of high Galactic foreground
confusion.
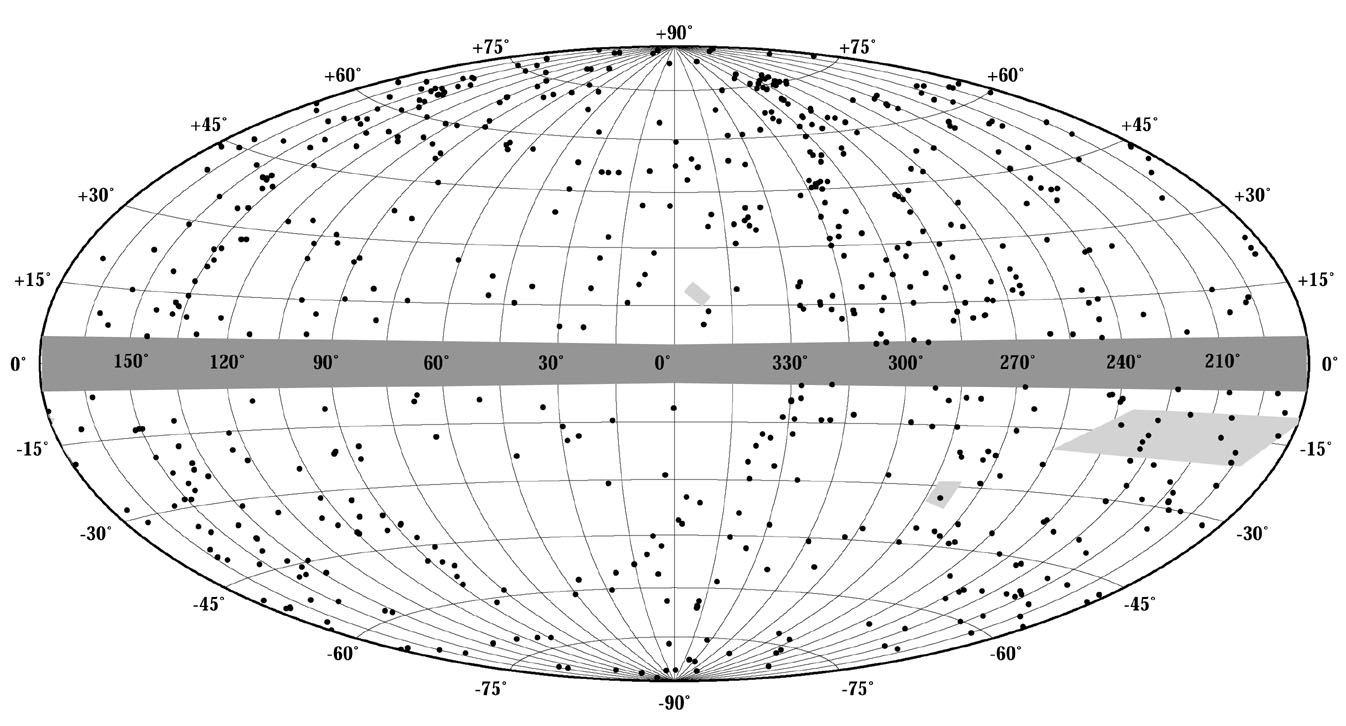 |
Figure 5. Aitoff projection in Galactic coordinates of all sources in the RBGS. The dark shaded region represents the Galactic plane region excluded from the survey (|b| < 5°). The three small lightly shaded regions denote areas with extensive contamination from nearby Galactic molecular clouds and the LMC (see text for detailed boundaries). The total survey area is 37,658 deg2, or 91.3% of the sky. |
In the BGS2,
Sanders et al. (1995)
explored the effect that decreasing
Galactic latitude might have on our ability to detect all of the real
60 µmgalaxies present. On the basis of the fact that there was
no statistically significant decrease in the density of sources detected
versus |b|, it was concluded that the BGS2 was essentially
complete down to the limit of ± 5°. We have re-examined this
issue using the new RBGS data. Figure 6 shows
the surface density of RBGS sources versus Galactic latitude. Although
the three bins (bin width
 b = 5°)
with the lowest surface density of sources all lie at
b < 40°, there is again no observed systematic decrease
in source
density with Galactic latitude, and the three lowest points are not that
extreme. However, we do not rule out the possibility that a few sources have
been missed at lower Galactic latitude, and in particular, that the
systematic low values at b = - 35° to -5° may reflect this
fact. What is most noticeable in the data of
Figure 6 is the
large excess surface density of sources in the northern hemisphere
compared to the south. This reflects the effect of the Local
Supercluster (e.g.,
Tully 1982).
b = 5°)
with the lowest surface density of sources all lie at
b < 40°, there is again no observed systematic decrease
in source
density with Galactic latitude, and the three lowest points are not that
extreme. However, we do not rule out the possibility that a few sources have
been missed at lower Galactic latitude, and in particular, that the
systematic low values at b = - 35° to -5° may reflect this
fact. What is most noticeable in the data of
Figure 6 is the
large excess surface density of sources in the northern hemisphere
compared to the south. This reflects the effect of the Local
Supercluster (e.g.,
Tully 1982).
 |
Figure 6. Surface density of RBGS objects versus Galactic latitude (b). The shaded region denotes the omitted survey region of ±5° around the Galactic plane. The line indicates the median value of log10(# source / deg2) = -1.80, or 0.016 sources per square degree for the whole sample. This plot illustrates the well-known excess of IRAS galaxies in the northern compared to the southern Galactic hemisphere, due primarily to the Virgo cluster centered near b = +74° as well as the local supercluster. |
In the original discussion of the properties of IRAS
bright galaxies (i.e. the 324 galaxies in the original BGS1 -
Soifer et al. 1987)
significant attention
was given to the effect of the nearby Virgo cluster, which was found to
be reflected in the BGS1 sample as an "over density" of
sources due to ~ 30 galaxies within a ~ 20° radius around M87 (taken to be the center of the Virgo cluster). These "Virgo galaxies" were shown to be
gas-rich spirals with relatively modest luminosity, i.e.
log(Lir /
L ) ~ 9.8
- 10.4. While
nearly all of these galaxies remain in the RBGS, the overall effect of
Virgo on the full RBGS sample is less. This is
partly due to the
~ 2 × increase in the total number of galaxies in the RBGS, but is
also due to the realization that Virgo is simply one (albeit the largest)
of several galaxy concentrations within the Local Supercluster (e.g.
Tully 1982;
Tully & Shaya 1984).
We have chosen not to formally separate out
the properties of Virgo galaxies from the overall properties of the RBGS,
but instead will simply point out the effect of Virgo on the distribution
of RBGS galaxy properties where appropriate.
) ~ 9.8
- 10.4. While
nearly all of these galaxies remain in the RBGS, the overall effect of
Virgo on the full RBGS sample is less. This is
partly due to the
~ 2 × increase in the total number of galaxies in the RBGS, but is
also due to the realization that Virgo is simply one (albeit the largest)
of several galaxy concentrations within the Local Supercluster (e.g.
Tully 1982;
Tully & Shaya 1984).
We have chosen not to formally separate out
the properties of Virgo galaxies from the overall properties of the RBGS,
but instead will simply point out the effect of Virgo on the distribution
of RBGS galaxy properties where appropriate.
In the Aitoff all-sky plot shown in Figure 5, one of the most obvious features is the asymmetry in the relative number of IRAS bright galaxies found in the north (370) versus the south (259). Tully (1982) has previously shown that this asymmetry is also found for optically selected galaxies, and that it can be accounted for by a relatively small number of "concentrations" within the Local Supercluster, which lies almost entirely at high Galactic latitude. The cumulative affect of the Local Supercluster produces the prominent broad peak in the surface density distribution of IRAS bright galaxies versus Galactic latitude (b ~ +50° to +85°) in Figure 6.