


4.4. How big is a causally connected patch of the CMB without and with inflation?
From Fig. 4 we can read off
the x axis that the comoving radius of the
base of the small light cone under points A or B is
r = Ro
 ~ billion light years.
This is the current size of the patch that was causally connected at
last scattering.
The physical size D of the particle horizon today is
D
~ billion light years.
This is the current size of the patch that was causally connected at
last scattering.
The physical size D of the particle horizon today is
D  47 billion
light years (Fig. 4).
The fraction f of the sky occupied by one causally connected
patch is f =
47 billion
light years (Fig. 4).
The fraction f of the sky occupied by one causally connected
patch is f =  r2 / 4
D2
1/9000. The area of the full sky is about 40, 000 square
degrees (4 steradians). The
area of a causally connected patch is
(area of the sky) × f = 40,000 / 9,000
4 square degrees.
r2 / 4
D2
1/9000. The area of the full sky is about 40, 000 square
degrees (4 steradians). The
area of a causally connected patch is
(area of the sky) × f = 40,000 / 9,000
4 square degrees.
With inflation, the size of the causally connected patch depends on how many e-foldings of expansion occurred during inflation. To solve the horizon problem we need a minimum of ~ 60 e-folds of expansion or an expansion by a factor of ~ 1030. But since this is only a minimum, the full size of a causally connected patch, although bigger than the observable universe, will never be known unless it happens to be between 47 Glyr (our currentm particle horizon) and 62 Glyr (the comoving size of our particle horizon at the end of time).
The constraint on the lower limit to the number of e-foldings ~ 60
(or ~ 1030 ) comes from the requirement to solve the horizon
problem.
What about the upper limit to the number of e-folds? How big is our
inflationary bubble?
How big the inflationary patch is depends sensitively on
when inflation happened, the height of the inflaton potential and how long
inflation lasted (ti, te and
 inf at
Eq. 26) -
which in turn depends on the decay rate of the false vacuum.
Without a proper GUT, these numbers cannot be approximated with any
confidence. It is certainly reasonable to expect homogeneity to continue
for some distance beyond our
observable universe but there does not seem to be any reason why it
should go on forever. In eternal inflation models, the homogeneity
definitely does not go on forever
(Liddle & Lyth 2000).
inf at
Eq. 26) -
which in turn depends on the decay rate of the false vacuum.
Without a proper GUT, these numbers cannot be approximated with any
confidence. It is certainly reasonable to expect homogeneity to continue
for some distance beyond our
observable universe but there does not seem to be any reason why it
should go on forever. In eternal inflation models, the homogeneity
definitely does not go on forever
(Liddle & Lyth 2000).
When could inflation have occurred? The earliest time is the Planck time at 1019 GeV or 10-43 seconds. The latest is at the electroweak symmetry breaking at 102 GeV or 10-12 seconds. The GUT scale is a favorite time at 1016 GeV or 10-35 seconds. "Beyond these limits very little can be said for certain about inflation. So most papers about inflationary models are more like historical novels than real history, and they describe possible interactions that would be interesting instead of interactions that have to occur. As a result, inflation is usually described as the inflationary scenario instead of a theory or hypothesis. However, it seems quite likely that the inflation did occur, even though we don't know when, or what the potential was." - Wright (2003).
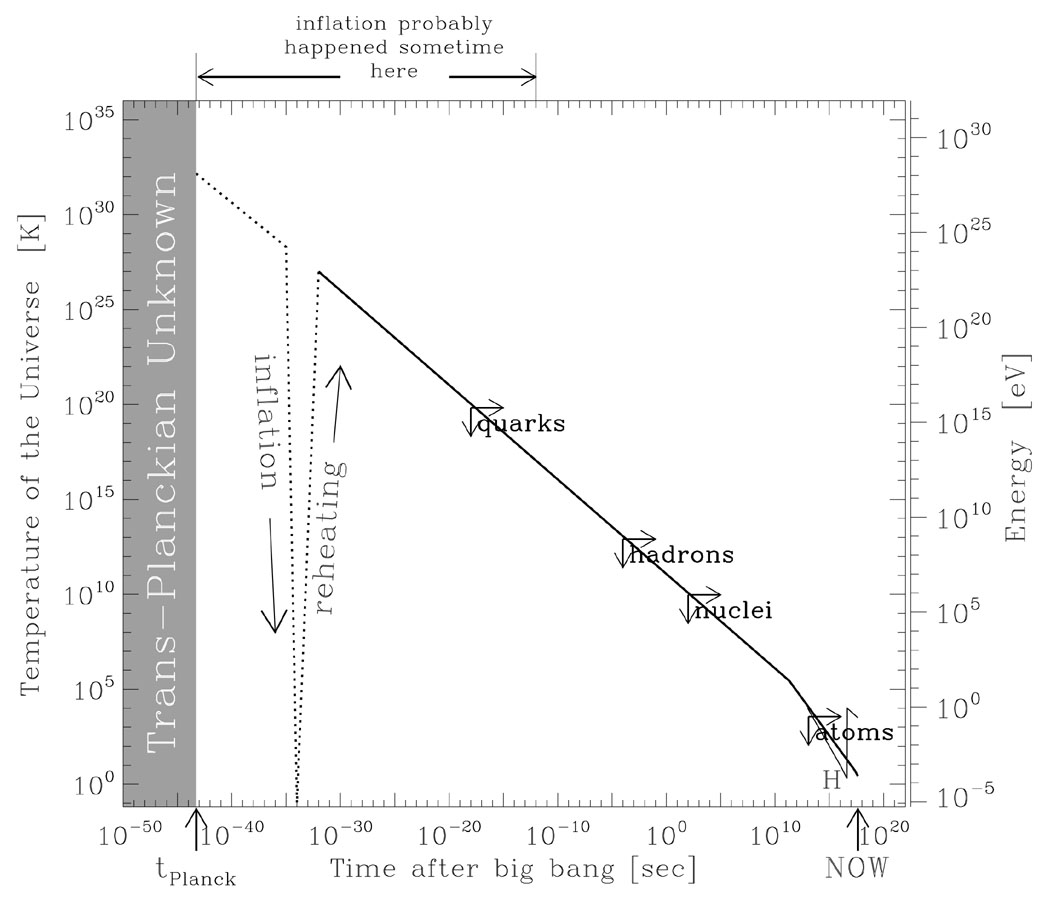 |
Figure 6. Temperature of the Universe. The temperature and composition history of the standard big bang model with an epoch of inflation and reheating inserted between 10-35 and 10-32 seconds after the big bang. Inflation increases the size of the Universe, decreases the temperature and dilutes any structure. Reheating then creates matter which decays and raises the temperature again. This plot is also an overview of the energy scales at which the various components of our Universe froze out and became permanent features. Quarks froze into protons and neutrons (~ GeV), protons and neutrons froze into light nuclei (~ MeV), and these light nuclei froze into neutral atoms (~ eV) which cooled into molecules and then gravitationally collapsed into stars. And now, huddled around these warm stars, we are living in the ice ages of the Universe with the CMB at 3K or ~ 10-3 eV. |
 |
 |
Figure 7. Real Structure (top) is not Random (bottom). If galaxies were distributed randomly in the Universe with no large scale structure, the 2dF galaxy redshift survey of the Local Universe would have produced the lower map. The upper map it did produce shows galaxies clumped into clusters radially smeared by the fingers of God, and empty voids surrounded by great walls of galaxies. The same number of galaxies is shown in each panel. Since all the large scale structure in the Universe has its origin in inflation, we should be able to look at the details of this structure to constrain inflationary models. A minimalistic set of parameters to describe all this structure is the amplitude and the scale dependence of the density perturbations. |