


6.1. The morphology and sizes of high-redshift galaxies
One of the key questions in galaxy formation and evolution is the importance of interactions and mergers. In particular, cold-dark-matter and dark-energy dominated models have as one of their natural consequences a higher merger rate in the past, since in these models, today's Hubble Sequence galaxies have been assembled via a process of hierarchical mergers (e.g., Cole et al. 2000, Kauffmann et al. 1999, Somerville, Primack, and Faber 2001).
In the local universe, the luminosity density is dominated by
ellipticals, lenticulars and spirals, even though dwarf ellipticals and
dwarf irregulars (all of low luminosity) dominate by number. The HDF-N
allowed for the first time for a morphological classification of
galaxies down to a magnitude of I = 25 (e.g.,
Abraham et
al. 1996).
These studies showed that the fraction of irregular, multiple-component,
and peculiar-looking galaxies was indeed considerably higher (~ 40%)
than expected from a direct extrapolation of the numbers at z
 0. The trend of a
rising fraction of faint systems with irregular morphology was already
noted in HST's Medium Deep Survey
(Griffiths
et al. 1994,
Windhorst et
al.
1995), although there, the survey reached only down to I ~ 23.
0. The trend of a
rising fraction of faint systems with irregular morphology was already
noted in HST's Medium Deep Survey
(Griffiths
et al. 1994,
Windhorst et
al.
1995), although there, the survey reached only down to I ~ 23.
One worry one might have when examining the morphologies of galaxies at
high redshift is that optical images reflect, in fact, the UV rest frame
images of the galaxies. Since the UV light traces, in particular,
pockets of intense star formation, one might expect a more irregular
appearance for high-redshift galaxies
(Giavalisco
et al. 1996).
A study of the redshift distribution of galaxies with
17 < I < 21.5
(Im et al.
1999),
showed indeed the irregular/peculiar class to consist of both
low-redshift dwarfs and intermediate redshift
(0.4  z
1) galaxies that
are by themselves a mix of starbursts (of relatively low mass) and more
massive, interacting galaxies.
z
1) galaxies that
are by themselves a mix of starbursts (of relatively low mass) and more
massive, interacting galaxies.
Nevertheless, Brinchmann et al. (1998) and Abraham et al. (1999a) have shown that the redshifting of UV wavelengths into the optical is not sufficient to explain the preponderance of irregular morphologies. Further confirmation that the rapid rise with redshift in the fraction of galaxies with irregular/peculiar morphologies is real, came from the Near Infrared Camera and Multi Object Spectrograph (NICMOS) observations. The NICMOS observations (Thompson et al. 1999, Dickinson 2000a, Dickinson 2000b) have demonstrated that with very few (interesting by themselves) exceptions, the irregularities seen in the optical (WFPC2) image persist in the infrared image (Fig. 25), even at redshifts as high as z ~ 3. Since the NICMOS observations reflect the rest-frame optical light (up to z ~ 3), the absence of any significant changes in the morphology (in the majority of galaxies) proves that the peculiarities are not artifacts of wavelength shifting.
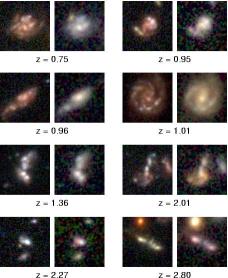 |
Figure 25. Optical and near-infrared images of distant galaxies in the Hubble Deep Field North. For each galaxy, the left panel shows a composite of WFPC2 images, while the right panel shows a new-infrared view with NICMOS. Courtesy of Mark Dickinson. |
A morphological trend that may be indicated by the HDFs is a significant
decline in the fraction of barred spirals with redshift
(for z
 0.5; e.g.,
Abraham et
al. 1999b).
However, since bars are more difficult to detect at bluer rest
wavelengths, optical surveys of galaxies at high-z may be biased
against finding bars
(Eskridge et
al. 2000,
van den Bergh et
al. 2002).
The precise reason for this trend (if confirmed) is not known, but it
may be related either to the state of the disk (the development of a bar
instability requires a cold disk), or to the timescale needed to form
long-lived bars (perhaps through episodic growth, aided by spiral
patterns;
Selwood 2000).
0.5; e.g.,
Abraham et
al. 1999b).
However, since bars are more difficult to detect at bluer rest
wavelengths, optical surveys of galaxies at high-z may be biased
against finding bars
(Eskridge et
al. 2000,
van den Bergh et
al. 2002).
The precise reason for this trend (if confirmed) is not known, but it
may be related either to the state of the disk (the development of a bar
instability requires a cold disk), or to the timescale needed to form
long-lived bars (perhaps through episodic growth, aided by spiral
patterns;
Selwood 2000).
Another extremely interesting result to have come out of the HDFs is
related to the sizes of galaxies. When examining the HDFs, one is
immediately struck by the small angular diameters of the faint
galaxies. In particular, No-Evolution models (e.g.,
Bouwens, Cayon,
and Silk 1997),
Pure Luminosity Evolution models
(in which galaxies form at some redshift and are characterized by their
star-formation history, but no merging occurs; e.g.,
Metcalfe et
al. 1996),
and models dominated by low-surface-brightness galaxies
(e.g.,
Ferguson and
McGaugh 1995),
all produce half-light radii that are considerably larger than those
observed for 24
I 27.5.
Roche et
al. (1998),
who used profile fitting to determine half-light radii, also find that
at z > 0.35 galaxies are significantly more compact than
predicted by Pure Luminosity Evolution models (although no evolution in
the size was found for z
0.35), and more
generally, that galaxies at z
2 are more
compact than today's L* galaxies.
There is no question that the most attractive explanation for the higher
fraction of morphologically peculiar, and smaller galaxies in the past
(beyond z 1
smaller angular sizes correspond to smaller physical sizes, essentially
irrespective of the cosmological model), is in terms of hierarchical
galaxy formation and interactions. In the context of this model, the
highly irregular morphologies are a consequence of interactions (that
were more frequent in the denser past), direct collisions, and
mergers. In this picture, the smaller size objects are essentially the
"building blocks" of today's galaxies.
Some attempts have been made to transform this qualitative statement into a quantitative tool. While the Hubble Sequence classification (Hubble 1926) has proved extremely useful for analyzing the gross morphological properties of nearby galaxies, it becomes rather ineffective at high redshifts, when mergers and intense star formation become the rule, rather than the exception.
A method that is quite successful in distinguishing between irregular galaxies forming stars stochastically and irregularities induced by mergers is based on color-asymmetry diagrams (e.g., Conselice 1997, Bershady, Jangren, and Conselice 2000). In these diagrams, galaxies are placed in the [(B - V), A] plane, where A is an asymmetry parameter, based on comparing the galaxy image with its counterpart obtained through a rotation by 180°. Formally, the asymmetry parameter is defined by
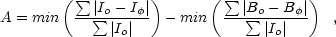 |
(23) |
where Io is the intensity distribution in the image
pixels, I is the intensity distribution in the rotated image
(by angle
), and B
is the intensity in background pixels (with the second term correcting
for the noise). A calibration using nearby galaxies
(Conselice,
Bershady, and Jangern 2000)
shows that all the galaxies with A > 0.35 represent merging
systems. Galaxies with enhanced star formation rates are bluer and may
become asymmetric due to pockets of star formation. Nevertheless, their
asymmetry parameter does not exceeed 0.35.
is the intensity distribution in the rotated image
(by angle
), and B
is the intensity in background pixels (with the second term correcting
for the noise). A calibration using nearby galaxies
(Conselice,
Bershady, and Jangern 2000)
shows that all the galaxies with A > 0.35 represent merging
systems. Galaxies with enhanced star formation rates are bluer and may
become asymmetric due to pockets of star formation. Nevertheless, their
asymmetry parameter does not exceeed 0.35.
An examination of the color-asymmetry diagram of the HDF-N shows that
the highest fraction of mergers is found in the highest redshift range,
1.5 < z < 2.5. Using A > 0.35 and
MB < - 18 as criteria for mergers, gives for the
merger fraction as a function of redshift
f  (1 +
z)2.1 ± 0.5
(Conselice
2001).
While considerable uncertainties still exist, this suggests that the
evolution of galaxies may indeed be primarily dominated by
mergers. Furthermore, the merger fraction appears to be starting to
flatten (or possibly even to decline) for z
2. As we shall
soon see, this may be related to the behavior of the star formation rate
with redshift.
(1 +
z)2.1 ± 0.5
(Conselice
2001).
While considerable uncertainties still exist, this suggests that the
evolution of galaxies may indeed be primarily dominated by
mergers. Furthermore, the merger fraction appears to be starting to
flatten (or possibly even to decline) for z
2. As we shall
soon see, this may be related to the behavior of the star formation rate
with redshift.
Additional information about hierarchical vs. monolithic
formation models comes from studies of elliptical galaxies. In the
former scenario, giant ellipticals form via mergers of galaxies of
comparable mass that had already (prior to merger) used up at least some
of their gas to form stars (e.g.,
Kauffmann,
White and Guideroni 1993).
In the monolithic scenario, on the other hand (e.g.,
Eggen, Lynden-Bell
and Sandage 1962,
Tinsley and Gunn
1976),
ellipticals form at high redshifts via a single collapse (and a
concomitant starburst), and evolve passively thereafter. The two
pure models have rather distinct observational
predictions. Clearly, in the hierarchical scenario the number density of
ellipticals is expected to decrease with increasing
redshift. This can be contrasted with the predictions of the monolithic
scenario: the number density of ellipticals should stay fairly constant
with redshift, but the bolometric luminosity is expected in increase (up
to the starburst phase). The observations, however, proved to be more
ambiguous than one might have hoped. In particular,
Treu and Stiavelli
(1999)
found that while Pure Luminosity Evolution models in which all
ellipticals are assumed to form at z
5 over-predict the
observed counts, these models tend to under-predict the counts when the
formation redshift is assumed to be z
2 (see also
Zepf 1997,
Franceschini
et al. 1998,
Benitez et
al. 1999).
Thus, the observations with both ground-based surveys and HST suggest a
picture which is somewhat intermediate between the pure
hierarchical and monolithic scenarios. Namely, objects that resemble
elliptical galaxies (red, obeying a R1/4 law in their
luminosity profile) existed already at moderately high (z
1.5) redshifts
(e.g.,
McCarthy et
al. 2001,
Moustakas and
Somerville 2002).
These objects continued, however, to experience mergers until z ~
1, from which time on the resulting giant ellipticals evolved mostly
passively (see also
Giavalisco
2002).
The Advanced Camera for Surveys, installed on board HST in March 2002, is expected to produce a wealth of high-quality data on galaxy sizes and morphologies. We can therefore expect even more significant constraints on hierarchical formation models to emerge in the coming months.
As I noted above, the evolution of galaxies is also intimately related to the way they assemble their mass and, concomitantly, to their star formation rate. As it turned out, the HDF-N proved to be seminal in the discussion of the cosmic star formation history.