Copyright © 1999 by Annual Reviews. All rights reserved
| Annu. Rev. Astron. Astrophys. 1999. 37:
127-189 Copyright © 1999 by Annual Reviews. All rights reserved |


4.3. Strategies for Weak Lensing Surveys
The rather optimistic predictions from theoretical work reported in Section 4.1 are convincing enough to investigate in great detail how weak lensing surveys can be designed in order to maximize the signal to noise ratio of statistical and physical quantities, as well as to minimize the time spent for the survey. The definition of a best strategy addresses many issues: size, shape, topology of the survey, best statistical estimators, optimal analysis of the catalogues and best extraction of the signal from the raw data. This last point (measurement of ellipticities, correction of the PSF) has already been discussed in Section 3.3, so I will focus on the other aspects. Indeed, weak lensing surveys have rather generic constraints which are common to any survey in cosmology (see Szapudi & Colombi 1996, Kaiser 1998, Colombi et al 1998 and references therein). The main sources of noise are the cosmic variance, the intrinsic ellipticity distribution of the lensed galaxies and possibly the noise propagation during the mass reconstruction from lensing inversion. In addition, at such low shear level, the correction of the PSF, as well as the removals of systematics coming from optical and atmospheric degradation of the images, or from the method used to measure the shear from galaxy ellipticity, are crucial steps.
The impact of the size, the shape and the deepness of weak lensing surveys has been addressed by Blandford et al (1991), Kaiser (1992) and has been investigated in more detail by Kaiser (1998), Kamionkowski et al (1998), Van Waerbeke et al (1999), Jain et al (1998). Depending on the scientific goals and the nature of the data, medium-size deep, very-wide shallow and very-small ultra-deep surveys have been proposed.
The most detailed investigation done so far has been conducted by
Van Waerbeke et al
(1999). From a sample of 60 simulations
per set of parameters they computed the expected signal to noise ratio
of the variance and the skewness of the convergence, and they attempted
to reconstruct the projected mass density from the lensing
signal in order to recover the projected power spectrum for each model
on 5° × 5° and 10° × 10° noisy maps. They
included various
cosmologies, mass density power spectra, sampling strategies and
redshifts of sources. This work is a preparation of the subarcsecond seeing
survey which should be conducted at CFHT with the new wide field Megacam
camera (which will cover one square degree,
Boulade et al 1998).
These simulations show that the projected mass density
maps can be recovered with an impressive accuracy and demonstrate
that such a survey will be able to recover the projected power spectrum
of mass density fluctuations, from 2.5 arcminutes up to 2 degrees with a
signal to noise ranging from 10 to 3.
The power spectrum on small scales is dominated by the shot noise due to
the intrinsic ellipticity distribution of the background galaxies, but
it follows the statistics predicted by
Kaiser (1998)
which permits its easy removal. The best strategy suggested by
these simulations is a shallow survey with a typical galaxy number density
of 30 arcmin-2 over 10 × 10 square degrees. According to
Van Waerbeke et al
(1999) it will permit one
to separate  = 0.3
from = 1 universes
at a 6
= 0.3
from = 1 universes
at a 6 confidence level
Figure 7).
Kaiser (1998)
recommends a wide field as well, but suggests a sparse
sampling on a very large scale rather than a compact topology. This
alternative has not been investigated yet using simulations. In
particular, it would be useful to have quantitative estimates of the
scale beyond which the survey should switch from a compact to a sparse
sampling of the sky.
confidence level
Figure 7).
Kaiser (1998)
recommends a wide field as well, but suggests a sparse
sampling on a very large scale rather than a compact topology. This
alternative has not been investigated yet using simulations. In
particular, it would be useful to have quantitative estimates of the
scale beyond which the survey should switch from a compact to a sparse
sampling of the sky.
 |
Figure 7. Histograms of the values of the
skewness of the convergence for an
|
Alternatively, Stebbins (1996), Kamionkowski et al (1998) have explored the possibility of using shallower surveys, which sample the sky with only a few galaxies per arcminute, but cover about half the sky. Contrary to the Megacam-like surveys which aim at mapping the shear field and building a map of the projected mass density, these shallow surveys only aim at measuring the correlation of ellipticities on very large scales. Stebbins (1996, 1999) used the linear theory to compute the angular power spectrum of the shear inferred from a tensor spherical harmonic expansion of the shear pattern of an all-sky survey. He argues that the SDSS could provide reliable information on the projected angular power spectrum of the shear. The expected signal is very small, because most of the galaxies will be at a redshift lower than 0.2. The seeing of the site and the sampling of the images could have minor impact on the signal because these nearby galaxies should be much larger than the seeing disk. However, a simulation of the systematics which include the quality of the telescope and the instruments, as well as an estimate of the possible systematics produced by the drift-scanning are now necessary in order to have a clear quantitative estimate of the expected signal to noise ratio.
The use of the VLA-FIRST radio survey for weak lensing proposed by Kamionkowski et al (1998) looks promising. FIRST covers about the same area as the SDSS but the radiosource sample has a much broader redshift distribution and a median redshift beyond z = 0.2. However, with less than 100 sources per square degree, the sampling is rather poor. Kamionkowski et al predict an rms ellipticity of about 3% on 6 arcminutes, 1% on 20 arcminutes and on one degree scale, with a signal to noise ratio larger than 5, in good agreement with Bernardeau et al (1997), Jain & Seljak (1997). Preliminary results from this survey should soon be available.
On small scales, first attempts for measuring cosmic shear have already
been made by several groups.
Mould et al (1994)
used a very deep
image obtained at the Palomar Telescope to measure cosmic shear on a
scale of 5 arcminutes. They do not find a significant signal
(however, see JV Villumsen 1995, unpublished results) and argued that
the cosmological signal of their field is below 4%. A similar attempt
has been made by
Fahlman et al (1994)
on a 15 arcmin field. The images were obtained at CFHT in subarcsecond
seeing conditions
( 0.5", against
0.9" for Mould
et al), but significantly less deep than the Mould et al
observations. Fahlman et al did not detect any significant signal,
though owing to the
excellent seeing, they expected it to be three times more sensitive. On the
other hand, a weak lensing signal has already been detected on a 2 arcmin
scale around radiosources and quasars (see
Section 4.2), which shows
that cosmic shear on a small scale is detectable.
Schneider et al
(1998a) argued that the shear
detected around radiosources is cosmic shear, though the sample is probably
biased toward non-linear structures because the fields are preferentially
selected around bright quasars. This is probable because the
motivation of the
Fort et al (1996)
observations (from which the Fort et al and Schneider et al sample is
based) was the verification of the
Bartelmann et al (1994)
hypothesis that the quasar-galaxy association results from a magnification
bias of bright quasar samples by large-scale structures. Therefore, if the
magnification bias really works then the cosmological significance of the
Schneider et al
(1998a)
interpretation is difficult to quantify. Conversely, if the
quasar-galaxy associations are not produced by such magnification, then
Schneider et al measured the cosmic shear for the first time.
0.5", against
0.9" for Mould
et al), but significantly less deep than the Mould et al
observations. Fahlman et al did not detect any significant signal,
though owing to the
excellent seeing, they expected it to be three times more sensitive. On the
other hand, a weak lensing signal has already been detected on a 2 arcmin
scale around radiosources and quasars (see
Section 4.2), which shows
that cosmic shear on a small scale is detectable.
Schneider et al
(1998a) argued that the shear
detected around radiosources is cosmic shear, though the sample is probably
biased toward non-linear structures because the fields are preferentially
selected around bright quasars. This is probable because the
motivation of the
Fort et al (1996)
observations (from which the Fort et al and Schneider et al sample is
based) was the verification of the
Bartelmann et al (1994)
hypothesis that the quasar-galaxy association results from a magnification
bias of bright quasar samples by large-scale structures. Therefore, if the
magnification bias really works then the cosmological significance of the
Schneider et al
(1998a)
interpretation is difficult to quantify. Conversely, if the
quasar-galaxy associations are not produced by such magnification, then
Schneider et al measured the cosmic shear for the first time.
Several low-angular scale surveys are under way to provide significantly better statistics. These surveys have been summarized by Seitz et al (1999). A promising strategy consists of using the parallel Space Telescope Imaging Spectrometer (STIS) observations of HST as randomly selected fields. For each of those outstanding images, it is possible to measure the average distortion with a very high confidence level. Preliminary analyses by Seitz et al (1999) show that the PSF is incredibly stable and that the first observations lead to an rms ellipticity of 3% on one arcminute scale, which is very encouraging. However, for the moment it is difficult to interpret the rms shear in terms of constraints for cosmological models because the STIS parallel observations are done without filter, so there is no color information on the lensed galaxies to constrain their average redshift.
In addition to the definition of the survey strategy, the scientific
return is sensitive to the technique used to analyze the catalogues.
In this respect, the best procedure depends on the noise properties
on the survey. In theory, if the noise follows Gaussian
statistics, the Wiener filtering should provide a minimum variance
estimator of cosmological quantities
(Seljak 1997a).
However, it is not
obvious that this is the best approach, in particular on small scales
where non-linear features deviate significantly from gaussianity. For
instance,
Kruse & Schneider
(1999) have explored
a strategy for an optimal extraction of the high density peaks present in
surveys. It uses the aperture mass densitometry for cosmic shear
measurement proposed by
Schneider et al
(1998b)
which permits the detection of peaks of the projected mass density as
function of the tangential shear,
 t
(Kaiser 1995).
This simple and
rather robust approach which focuses on the most contrasted systems
should provide in a simple way some constraints of the number density of
high peaks, and therefore of the cosmological scenarios.
Schneider et al
(1998b)
argued that the use of a compensated filter is an
optimal procedure to measure
t
(Kaiser 1995).
This simple and
rather robust approach which focuses on the most contrasted systems
should provide in a simple way some constraints of the number density of
high peaks, and therefore of the cosmological scenarios.
Schneider et al
(1998b)
argued that the use of a compensated filter is an
optimal procedure to measure
 from
without mass reconstruction because in
contrast to the top hat filter, it selects a sharp scale range that cancels
the additional noise produced by the adjacent wave numbers. The merit of
the two filterings has also been investigated in detail in the simulations
of Van Waerbeke et al
(1999). They found that the
best choice is unclear: the compensated filter is better for
the variance, but is worse for the skewness (see
Figure 8, color).
from
without mass reconstruction because in
contrast to the top hat filter, it selects a sharp scale range that cancels
the additional noise produced by the adjacent wave numbers. The merit of
the two filterings has also been investigated in detail in the simulations
of Van Waerbeke et al
(1999). They found that the
best choice is unclear: the compensated filter is better for
the variance, but is worse for the skewness (see
Figure 8, color).
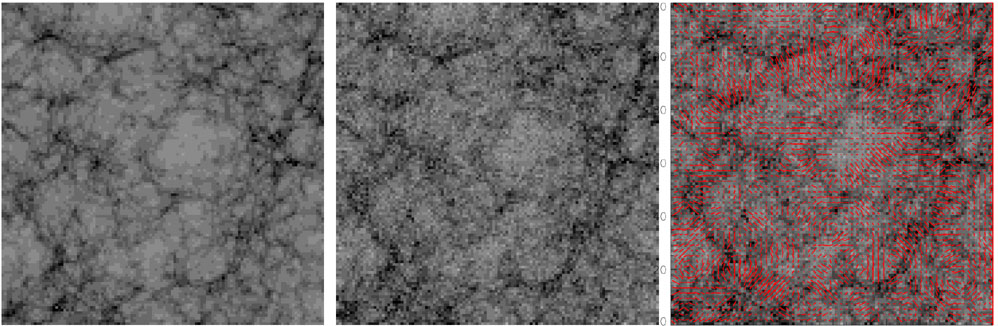 |
Figure 8. Simulation of mass maps construction from a wide field weak lensing survey. The left panel is the original simulated projected mass density of large scale structures. The field covers 25 square degrees. The middle panel is the reconstructed mass map using the algorithm described in Van Waerbeke et al (1998). The noise introduced in the simulated map is due to the intrinsic ellipticity distribution of the lensed galaxies. The similarity with the original mass map is striking. The right panel is the shear map overlayed to the projected mass map. The length and the orientation of each line indicate the amplitude and the orientation of the shear. |