


The next component to be considered is
the all-pervading intergalactic medium which manifests
itself as a multitude of individual
Ly absorption lines
bluewards of the Ly
emission line of every QSO. As can be appreciated from
Figures 13 and 14,
the effect is dramatic at high redshift.
Observationally, the term
Ly forest is used to
indicate absorption lines with column densities in the range
1016
absorption lines
bluewards of the Ly
emission line of every QSO. As can be appreciated from
Figures 13 and 14,
the effect is dramatic at high redshift.
Observationally, the term
Ly forest is used to
indicate absorption lines with column densities in the range
1016
 N(HI)
1012 cm-2
(see Figure 5).
N(HI)
1012 cm-2
(see Figure 5).
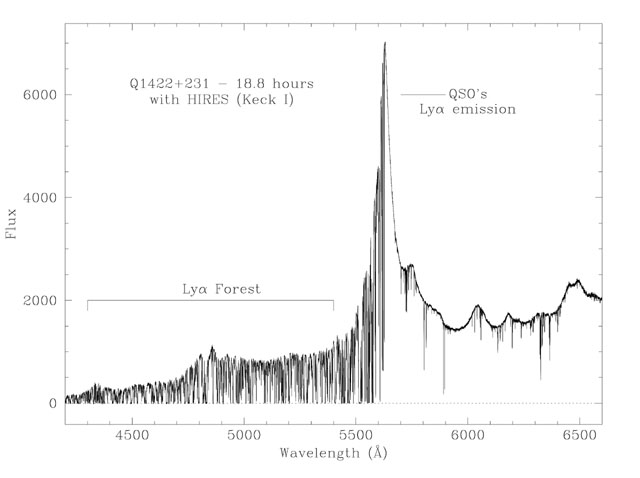 |
Figure 13. (Reproduced from
Ellison 2000).
This is one of the best QSO spectra ever obtained
thanks to the combination of the bright magnitude of the
gravitationally lensed QSO Q1422+231 (V = 16.5), long exposure
time (amounting to several nights of observation), and
high spectral resolution offered by the Keck echelle
spectrograph (FWHM |
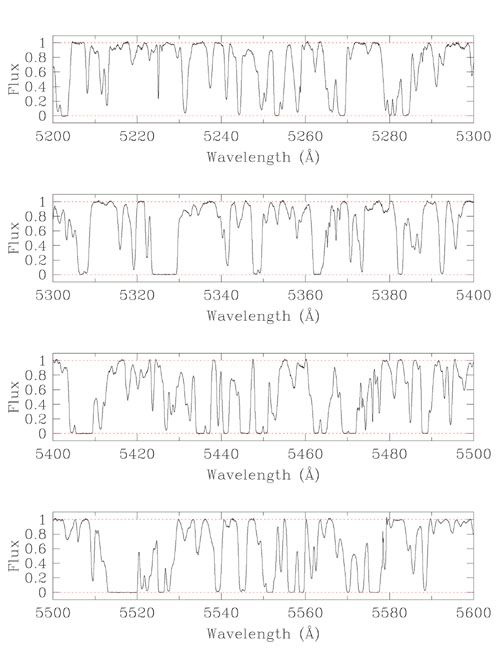 |
Figure 14. (Reproduced from
Ellison 2000).
Portion of the Ly |
Hydrodynamical simulations have shown that the
Ly forest
is a natural consequence of the formation of large scale structure
in a universe dominated by cold dark matter
and bathed in a diffuse ionising background (see
Weinberg, Katz, &
Hernquist 1998
for an excellent review of the
ideas which have led to this interpretation).
An example is reproduced in Figure 15.
Artificial spectra generated by throwing random sightlines
through such model representations of the high redshift universe
are a remarkably good match to real spectra of the
Ly forest.
In particular, the simulations are very successful at
reproducing the column density distribution of H I in
Figure 5,
the line widths and profiles, and the evolution
of the line density with redshift. Consequently, much of what we have
learnt about the IGM in the last few years has
been the result of a very productive interplay between
observations of increasing precision and simulations
of increasing sophistication. This modern view
of the Ly forest is
often referred to as the `fluctuating Gunn-Peterson' effect.
There are two important properties of the
Ly forest which we
should keep in mind. One is that it is highly ionised, so that
the H I we see directly is only a small fraction
(~ 10-3 to ~ 10-6) of the total amount of hydrogen
present. With this large ionisation
correction it appears that the forest can account for most of the
baryons at high, as well as low, redshift
(Rauch 1998;
Penton, Shull, &
Stocke 2000);
that is  Ly
Ly
 0.02
h-2.
Second, the physics of the absorbing gas is relatively simple
and the run of optical depth
0.02
h-2.
Second, the physics of the absorbing gas is relatively simple
and the run of optical depth
 (Ly) with redshift
can be thought of as a `map'
of the density structure of the IGM along a given line of sight.
At low densities, where
the temperature of the gas is determined by the balance between
photoionisation heating (produced by the intergalactic ionising
background) and adiabatic cooling (due to the expansion of the universe),
(Ly)
(Ly) with redshift
can be thought of as a `map'
of the density structure of the IGM along a given line of sight.
At low densities, where
the temperature of the gas is determined by the balance between
photoionisation heating (produced by the intergalactic ionising
background) and adiabatic cooling (due to the expansion of the universe),
(Ly)
 (1 +
(1 +
 )1.5, where
is the overdensity of
baryons
)1.5, where
is the overdensity of
baryons
 (
( b
/ <b> - 1).
At z = 3, (Ly) = 1 corresponds to a region
of the IGM which
is just above the average density of the universe at that time
(
0.6). The last
absorption line in the second
panel of Figure 14, near 5395Å, is an
example of a Ly line with
b
/ <b> - 1).
At z = 3, (Ly) = 1 corresponds to a region
of the IGM which
is just above the average density of the universe at that time
(
0.6). The last
absorption line in the second
panel of Figure 14, near 5395Å, is an
example of a Ly line with
 1.
The idea that, unlike galaxies,
the forest is an unbiased tracer of mass has prompted,
among other things, attempts to recover the initial spectrum of density
fluctuations
from consideration of the spectrum of line optical depths in the forest
(Croft et al. 2002)
1.
The idea that, unlike galaxies,
the forest is an unbiased tracer of mass has prompted,
among other things, attempts to recover the initial spectrum of density
fluctuations
from consideration of the spectrum of line optical depths in the forest
(Croft et al. 2002)
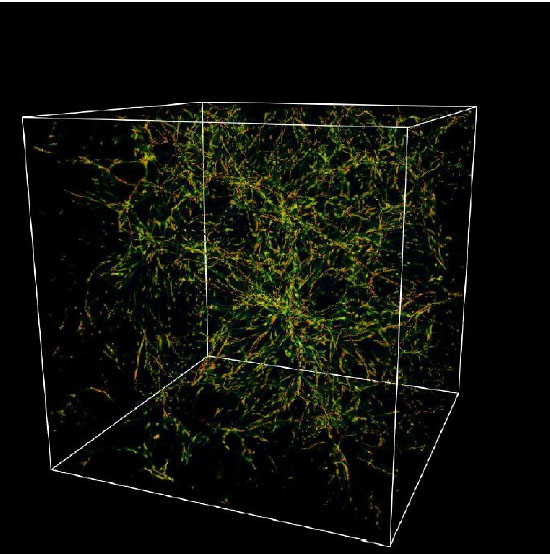 |
Figure 15. (Reproduced from
http://astro.princeton.edu/~cen). Distribution of
neutral gas at z = 3 from hydrodynamic cosmological simulation
in a spatially flat, COBE-normalized, cold dark matter model
with the cosmological parameters adopted in this article
(Section 1.1). The box size
is 25 Mpc / h (comoving) on the side, and the number of particles
used in the simualation is 7683. The structure seen in this
(and other similar simulations) reproduces very well the
spectral properties of the
Ly |