


Our knowledge of interstellar dust is largely derived from the interaction of dust particles with electromagnetic radiation: attenuation of starlight, scattering of light, and emission of infrared and far-infrared radiation.
The wavelength dependence of interstellar extinction
tells us about both the size and composition
of the grains. The extinction is best determined using the
"pair method" - comparison of the fluxes from two stars with
nearly-identical spectroscopic features (and therefore photospheric
temperature and gravity) but with one of the stars nearly unaffected
by dust. With the assumption that the extinction goes to zero as
wavelength 

 , it is possible to
determine the extinction
A as a function of wavelength (see, e.g.,
Fitzpatrick & Massa
1990,
and references therein).
, it is possible to
determine the extinction
A as a function of wavelength (see, e.g.,
Fitzpatrick & Massa
1990,
and references therein).
The extinction
A is
obviously proportional to the amount of dust, but
A /
A0,
the extinction normalized to some reference wavelength ,
characterizes the kind of dust present, and its size distribution.
The quantity
RV  AV / (AB - AV)
characterizes the slope of the extinction curve between
V = 0.55 µm and B = 0.44 µm; small
values of RV correspond to steep extinction curves.
AV / (AB - AV)
characterizes the slope of the extinction curve between
V = 0.55 µm and B = 0.44 µm; small
values of RV correspond to steep extinction curves.
In principle, the function
A /
A0 is unique to every
sightline, but
Cardelli et al. (1989)
found that the observed
A /
A0 can be approximated by
a one-parameter family of curves:
A /
A0 =
f(,
RV), where they chose
RV
AV / (AB - AV) as
the parameter because it varies significantly from one curve to another.
Cardelli et al. obtained functional forms for
f(,
RV) which provided a good fit to observational data;
Fitzpatrick (1999)
revisited this question and, explicitly correcting
for the finite width of photometric bands, obtained a slightly revised
set of fitting functions. Figure 1 shows the
Fitzpatrick (1999)
fitting functions, using
IC = 0.802 µm, the central wavelength of the
Cousins I band, as the reference wavelength.
The parameterization is shown for values of RV ranging
from 2.1 to 5.5, which spans the range of RV values
encountered on sightlines through diffuse clouds in the Milky Way.
Also shown is an empirical fit to the extinction measured toward
HD210121, showing how an individual sightline can deviate from the
one-parameter fitting function
f(,
RV).
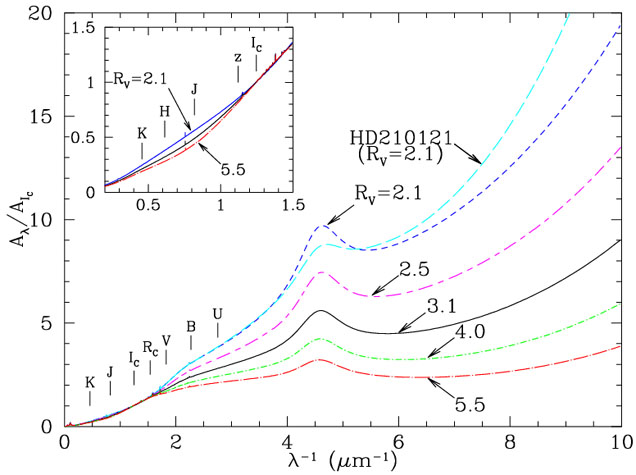 |
Figure 1. Extinction normalized to Cousins I band extinction for RV values ranging from 2.1 to 5.5, using the Fitzpatrick (1999) parameterization, plus diffuse interstellar bands following Jenniskens & Desert (1994). Also shown is an improved fit to the extinction curve toward HD21021, providing one example of how a sightline can deviate from the average behavior for the same value of RV. |
Dust on sightlines with different values of RV
obviously must have either different compositions or different size
distributions, or both. Also of interest is the total amount of dust per
unit H. This requires measurement of the total H column density
NH
N(H) + 2N(H2) + N(H+).
On most sightlines the ionized hydrogen is a small correction;
N(H) and N(H2) can be measured using
ultraviolet absorption lines.
Rachford et al. (2002) determined NH to an estimated accuracy of better than a factor 1.5 on 14 sightlines. It appears that AI / NH is positively correlated with RV, with
 |
(1) |
providing an empirical fit
(Draine 2003a).
We can use the
Fitzpatrick (1999)
parameterization and equation (1) to estimate
A / NH for sightlines with different
RV. The results are shown in
Figure 2 - sightlines with larger
RV values appear to have larger values of
A / NH for
-1
 3
µm-1, and decreased values for
-1
3
µm-1, and decreased values for
-1
 4
µm-1.
This is interpreted as resulting from coagulation of a fraction of
the smallest grains onto the larger grains;
loss of small grains decreases the ultraviolet extinction,
while adding mass to the larger grains increases the scattering at
0.3
µm.
4
µm-1.
This is interpreted as resulting from coagulation of a fraction of
the smallest grains onto the larger grains;
loss of small grains decreases the ultraviolet extinction,
while adding mass to the larger grains increases the scattering at
0.3
µm.
 |
Figure 2. Extinction per unit H column density, for different RV. From Draine (2003a). |