


Interstellar dust grains are heated primarily by absorption of starlight
photons.
A small fraction of the absorbed starlight energy goes into luminescence
or ejection of a photoelectron, but the major part of the absorbed starlight
energy goes into heating (i.e., vibrationally exciting)
the interstellar grain material.
Figure 5 shows
grain temperature vs. time simulated for four sizes of carbonaceous grains
exposed to the average interstellar radiation field. For grain radii
a  100
Å, individual photon absorptions are
relatively frequent, and the grain heat capacity is large enough that
the temperature excursions following individual photon absorptions
are relatively small; it is reasonable to approximate the grain temperature
as approximately constant in time. For
a
100
Å, individual photon absorptions are
relatively frequent, and the grain heat capacity is large enough that
the temperature excursions following individual photon absorptions
are relatively small; it is reasonable to approximate the grain temperature
as approximately constant in time. For
a  50 Å
grains, however, the grain is able to cool appreciably
in the time between photon absorptions; as a result, individual photon
absorption events raise the grain temperature to well above the mean value.
To calculate the time-averaged infrared emission spectrum for these grains,
one requires the temperature distribution function (see, e.g.,
Draine & Li 2001).
50 Å
grains, however, the grain is able to cool appreciably
in the time between photon absorptions; as a result, individual photon
absorption events raise the grain temperature to well above the mean value.
To calculate the time-averaged infrared emission spectrum for these grains,
one requires the temperature distribution function (see, e.g.,
Draine & Li 2001).
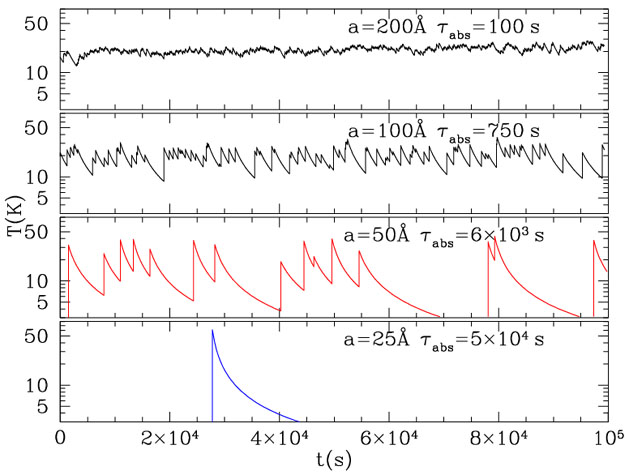 |
Figure 5. A day in the life of 4
carbonaceous grains, exposed to the average starlight background.
|
Figure 6 shows the average emission spectrum of interstellar dust, based on observations of the FIR emission at high galactic latitudes, plus observations of a section of the galactic plane where the surface brightness is high enough to permit spectroscopy by the IRTS satellite (Onaka et al. 1996; Tanaka et al. 1996).
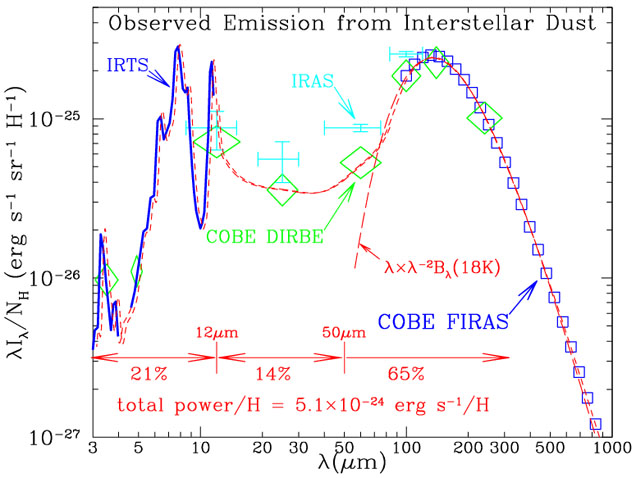 |
Figure 6. Observed emission spectrum of diffuse interstellar dust in the Milky Way. Crosses: IRAS (Boulanger & Perault 1988); squares: COBE-FIRAS (Finkbeiner et al. 1999); diamonds: COBE-DIRBE (Arendt et al. 1998); heavy curve for 3-4.5 µm and 5 - 11.5µm: IRTS (Onaka et al. 1996, Tanaka et al. 1996). The total power ~ 5.1 × 10⁻²⁴ ergs s-1 / H is estimated from the interpolated broken line. |
The similarity of the 5-15 µm
spectrum with that of reflection nebulae is evident
(see Figure 3).
Approximately 21% of the total power is radiated between 3 and 12
µm, with another ~ 14% between 12 and 50 µm.
This emission is from dust grains that are so small that single-photon
heating (see Figure 5) is important.
The remaining ~ 65 % of the power is radiated in the far-infrared,
with  I peaking at ~ 130 µm.
At far-infrared wavelengths, the grain opacity varies as
~ -2,
and
I
I peaking at ~ 130 µm.
At far-infrared wavelengths, the grain opacity varies as
~ -2,
and
I
 -6 /
(ehc /
k Td
- 1) peaks at
= hc / 5.985
k Td = 134 µm (18 K / Td).
The emission spectrum for 18 K dust with opacity
-2
shown in Figure 6, provides a good fit to the
observed spectrum for
-6 /
(ehc /
k Td
- 1) peaks at
= hc / 5.985
k Td = 134 µm (18 K / Td).
The emission spectrum for 18 K dust with opacity
-2
shown in Figure 6, provides a good fit to the
observed spectrum for
 80 µm, but falls
far below the observed emission at
80 µm, but falls
far below the observed emission at
 50 µm.
From Figure 6 it is apparent that ~ 60% of
the radiated power appears to originate from grains
which are sufficiently large (radii
a 100
Å ) so that individual photon absorption events do not appreciably
raise the grain temperature.
50 µm.
From Figure 6 it is apparent that ~ 60% of
the radiated power appears to originate from grains
which are sufficiently large (radii
a 100
Å ) so that individual photon absorption events do not appreciably
raise the grain temperature.
 abs
is the mean time between photon absorptions.
abs
is the mean time between photon absorptions.