


D. Hierarchical models
The clustering together of stars, galaxies, and clusters of galaxies in successively ordered assemblies is normally called a hierarchy, in a slightly different sense of the dictionary meaning in which there is a one-way power structure. The technically correct term for the structured universes of Kant and Lambert is multilevel. A complete multilevel universe has three consequences. One is the removal of Olbers paradox (the motivation of John Herschel and Richard Proctor in the 19th century). The second, recognized by Kant and Lambert, is that the universe retains a primary center and is therefore nonuniform on the largest cosmic scales. The third, recognized by the Irish physicist Fournier d'Albe and the Swedish astronomer Carl Charlier early in the 20th century is that the total amount of matter is much less than in a uniform universe with the same local density. D'Albe put forward the curious additional notion that the visible universe is only one of a series of universes nested inside each other like Chinese boxes. This is not the same as multiple 4-dimensional universes in higher dimensional space and does not seem to be a forerunner of any modern picture.
The idea that there should be structure on all scales up to that of the Universe as a whole goes back to Lambert (1761) who was trying to solve the puzzle of the dark night sky that is commonly called "Olber's paradox". (It was not formulated by Olbers and it is a riddle rather than a paradox (Harrison, 1987). Simply put: if the Universe were infinite and uniformly populated with stars, every line of sight from Earth would eventually meet the surface of a star and the sky would therefore be bright. The idea probably originated with John Herschel in a review of Humboldt's Kosmos where the clustering hierarchy is suggested as a solution to Olber's Paradox as an alternative to dust absorption.
At the start if the 20th century, The Swedish astronomer Carl Charlier provided a cosmological model in which the galaxies were distributed throughout the Universe in a clustering hierarchy (Charlier 1908, 1922). His motivation was to provide a resolution for Olber's Paradox. Charlier showed that replacing the premise of uniformity with a clustering hierarchy would solve the problem provided the hierarchy had an infinite number of levels (see Fig. 2).
 |
Figure 2. Hierarchical universes were very popular at the end of the 19th century and the first half of the 20th century. Reproduced from harri, Cosmology, Cambridge University Press. |
Charlier's idea was not new, though he was the first person to provide a correct mathematical demonstration that Olber's Paradox could indeed be resolved in this way. It should be recalled that he was working at a time before any galaxies had measured redshifts and long before the cosmic expansion was known.
It is interesting that the Charlier model had de Vaucouleurs as one of its long standing supporters (de Vaucouleurs, 1970).
More recently still there have been a number of attempts to re-incarnate such a universal hierarchy in terms of fractal models. Fractal models were first proposed by Fournier d'Albe (1907) and subsequently championed by Mandelbrot (1982) and Pietronero (1987). Several attempts have been made to construct hierarchical cosmological models (a Newtonian solution was found by Wertz (1971), general-relativistic solutions were proposed by Bonnor (1972); Wesson (1978); Ribeiro (1992)). All these solutions are, naturally, inhomogeneous with preferred position(s) for the observer(s), and thus unsatisfactory. So the present trend to conciliate fractal models with cosmology is to use the measure of last resort, and to assume that although the matter distribution in the universe is homogeneous on large scales, the galaxy distribution can be contrived to be fractal (Ribeiro, 2001). Numerical models of deep samples contradict this assumption.
Edwin F. Carpenter spent his early days at Steward Observatory (of which he was director for more than 20 years, from 1938) scanning zone plates to pick out extragalactic nebulae for later study. In 1931, he found a new cluster in the direction of Cancer (independently discovered by Hubble at about the same time.) He measured its size on the sky, estimated its distance, and counted the number of galaxies, N, he could recognize within its confines. This gave him a sample of 7 clusters with similar data, all from Mt. Wilson plates (5 in the Mt. Wilson director's report for 1929-30 and one then just found by Lundmark). He was inspired to graph log(N) vs. the linear sizes of the clusters (Carpenter, 1931) and found a straight line relation, that is, a power law in N(diameter), nowhere near as steep as N ~ D3 or N proportional to volume. The then known globular cluster system of the Milky Way (with about 35 clusters within 105 pc) also fit right on his curve.
Carpenter later considered a larger sample of clusters and found that a similar curve then acted as an upper envelope to the data (Carpenter, 1938). If his numbers are transformed to the distance scale with H0 = 100 km s-1 Mpc-1, then the relations are (de Vaucouleurs, 1971)
 |
(1) |
or
 |
(2) |
and the maximum number density in galaxies per Mpc3 is also proportional to 0.5 log(V). De Vaucouleurs called this Carpenter's law, though the discoverer himself had been somewhat more tentative, suggesting that this sort of distribution (which we would call scale free, though he did not) might mean that there was no fundamental difference among groups, clusters, and superclusters of galaxies, but merely a non-random, non-uniform distribution, which might contain some information about the responsible process. It is, with hindsight, not surprising that the first few clusters that Carpenter (1931) knew about were the densest sort, which define the upper envelope of the larger set (Carpenter, 1938). The ideas of a number of other proponents, both observers and theorists, on scale-free clustering and hierarchical structure are presented (none too sympathetically) in Chapter 2 of Peebles (1980).
3. De Vaucouleurs hierarchical model
De Vaucouleurs first appears on the cosmological stage doubting what was then the only evidence for galaxy evolution with epoch, the Stebbins-Whitford effect, which he attributed to observational error (de Vaucouleurs, 1948). He was essentially right about this, but widely ignored. He was at other times a supporter of the cosmological constant (when it was not popular) and a strong exponent of a hierarchical universe, in which the largest structures we see would always have a size comparable with the reach of the deepest surveys (de Vaucouleurs 1960, 1970, 1971). He pointed out that estimates of the age of the universe and of the sizes of the largest objects in it had increased monotonically (and perhaps as a sort of power law) with time since about 1600, while the densities of various entities vs. size could all be plotted as another power law,
 |
(3) |
By putting "Carpenter's Law" into modern units, de Vaucouleurs showed that it described this same sort of scale-free universe. A slightly more complex law, with oscillations around a mean, falling line in a plot of density vs. size (see Fig. 3), could have galaxies, binaries, groups, clusters, and superclusters as distinct physical entities, without violating his main point that what you see is what you are able to see.
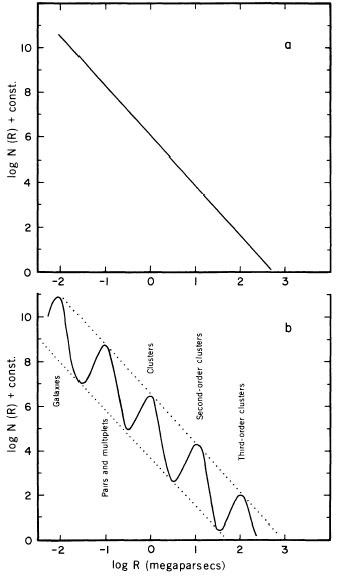 |
Figure 3. In this idealized diagram de Vaucouleurs shows two hierarchical frequency distributions of the number of clumps per unit volume. In the top panel there are no characteristic scales in the distribution. This is the model proposed by Kiang and Saslaw (1969). The bottom panel shows a more sophisticated alternative in which the overall decrease of the number of clumps per unit volume does not behave monotonically with the scale, but it displays a series of local maxima corresponding to the characteristic scales of different cosmic structures: galaxies, groups, clusters, superclusters, etc. Reproduced from de Vaucouleurs (1971), Astronomical Society of the Pacific. |
De Vaucouleurs said that it would be quite remarkable if, just at the moment he was writing, centuries of change in the best estimate for the age and density of the universe should stop their precipitous respective rise and fall and suddenly level off at correct, cosmic values. Thus he seemed to be predicting that evidence for a universe older than 10-20 Gyr and for structures larger than 100 Mpc should soon appear. (He held firmly to a value of H0 near 100 km s-1 Mpc-1 for most of his later career, except for the 1960 paper where it was 75, but thought of local measurements of H0 as being relevant only locally).
Remarkable, but apparently true. Instead of taking off again, estimates of the age of the universe made since 1970 from radioactive decay of unstable nuclides, from the evolution of the oldest stars, and from the value of the Hubble constant, increasingly concur. And galaxy surveys have now penetrated a factor 10 deeper in space than the Shane-Wirtanen and Harvard counts in which de Vaucouleurs saw his superclusters.