


D. Recent and on-going Surveys
The 2dF multi-fiber spectrograph on the 3.9m Anglo-Australian
Telescope is capable of observing up to 400 objects simultaneously
over a field of view some 2 degrees in diameter, hence the name of
the survey. The sample of galaxies targeted for having their
redshifts measured consists of some 250,000 galaxies located in
extended regions around the north and south Galactic poles. The
source catalog is a revised APM survey. The galaxies in the
survey go down to the magnitude bJ = 19.45. The median
redshift of the sample is z = 0.11 and redshifts extend to about
z  0.3. In
mid-2001 the survey team released the data on
the first 100,000 galaxies, and published also an interim report
on the analysis of some 140,000 galaxies:
Peacock et
al. (2001) and
Percival et
al. (2001).
0.3. In
mid-2001 the survey team released the data on
the first 100,000 galaxies, and published also an interim report
on the analysis of some 140,000 galaxies:
Peacock et
al. (2001) and
Percival et
al. (2001).
The survey is already complete, and the resulting correlation functions, redshift distortions and pairwise velocity dispersions (Hawkins et al., 2003) demonstrate the quality of the data set. The 2dFGRS currently provides us with the best estimates for a large number of cosmological parameters describing the population of galaxies. Not only can we determine clustering properties of the sample as a whole, but the sample can be broken down by galaxy absolute brightness or by morphological type (Percival et al., 2004). The surveys's web page is http://www.mso.anu.edu.au/2dFGRS/.
Hot on the heels of the 2dF survey is an even larger survey: the
Sloan Digital Sky Survey (SDSS). The survey team has close to two
hundred members from 13 institutions in U.S., Europe, and Japan,
and uses a dedicated 2.5 m telescope. The initial photometric
program is measuring the positions and luminosities of about
108 objects in  sterradians of the Northern sky, and the
follow-up spectroscopy is planned to give redshifts of about
106 galaxies and 105 quasars. Good descriptions of
the survey can be found in
Loveday (2002)
and on the surveys's web page (http://www.sdss.org/).
sterradians of the Northern sky, and the
follow-up spectroscopy is planned to give redshifts of about
106 galaxies and 105 quasars. Good descriptions of
the survey can be found in
Loveday (2002)
and on the surveys's web page (http://www.sdss.org/).
The first official data release was done in 2003, but the astronomical community had already have the chance to see and use the data from a preliminary Early Data Release (Stoughton et al., 2002). These data and the data from the commissioning phase of the project have served as a basis for more than one hundred papers on such diverse subjects as the study of asteroids, brown dwarf stars in the vicinity of the Sun, remnants of destroyed satellites of our Galaxy, star formation rates in galaxies, galaxy luminosity functions, and, of course, on the statistics of the galaxy distribution.
The main difference between the 2dF and the SDSS surveys, apart of
their data volume and sky coverage, is the fact that they are
based on different selection rules. While the 2dF survey is a
blue-magnitude limited survey with blim = 19.45,
the limiting magnitude of the SDSS
survey is red rlim = 17.77.
This causes considerable differences in galaxy
morphologies of the two surveys. Also, while the depths of the
main surveys are similar (z
 0.25), a
part of the SDSS survey, including about 105 luminous red
galaxies, will reach redshifts
z 0.5.
0.25), a
part of the SDSS survey, including about 105 luminous red
galaxies, will reach redshifts
z 0.5.
The Two Micron All Sky Survey (2MASS) has scanned the whole sky in three different near-infrared bands. The Extended Source Catalog (XSC) is the 2MASS galaxy catalog (Jarrett, 2004) and contains more then 1.5 million galaxies, mapping rather well the zone of avoidance, The view of our local universe provided by 2MASS is shown in Fig. 7.
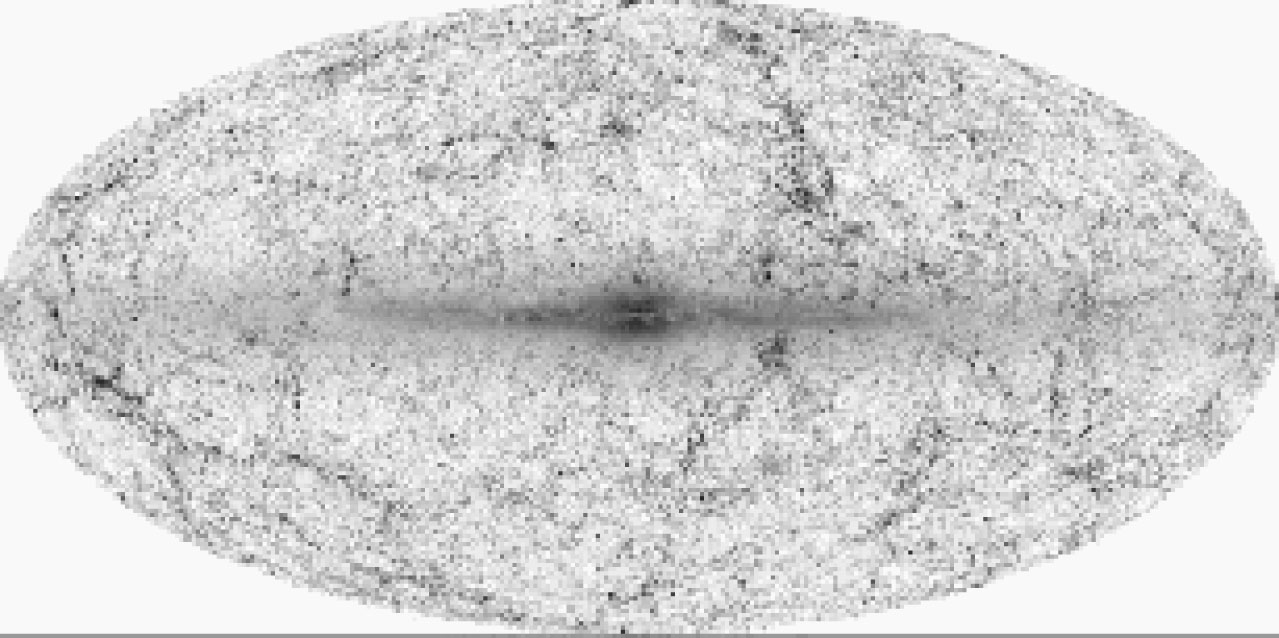 |
Figure 7. The near-infrared view of the local universe provided by the 2MASS survey. Beyond the Milky Way lying at the Galactic equator, more than 1.5 million galaxies are depicted using a grey-scale code based on their photometrically deduced redshift, from Jarrett (2004). |
The 6dF galaxy survey (Jones et al., 2004) targeted on the 2MASS galaxy catalog (XSC) will encompass twice the volume of the PSCz and will contain ten times more galaxies, allowing combined knowledge of galaxy masses and redshift. It will be the best sample for studies of the peculiar velocity field, allowing a better understanding of the relation of galaxy clustering with mass, and hence providing important clues to understand how bias depends on the scale.
4. Deep spectroscopic and photometric surveys
Deep spectroscopic surveys such as the Canadian Network for
Observational Cosmology (CNOC2)
(Yee et al., 2000),
DEEP2 (Davis et
al., 2003),
and the Visible Imaging Multi-Object Spectrograph (VIRMOS-VLT) survey
(Le Fèvre et
al., 2003)
have allowed the study of the evolution of
clustering with redshift and with various morphological properties
of galaxies
(Carlberg et
al., 2000,
Coil and DEEP2 Team
2003).
Nevertheless, it is extremely
difficult to measure redshifts of very faint objects. The
present limit reached making use of the largest
ground-based telescopes is about
I 24. An
alternative to spectroscopy, is the poor man z- machine
(Koo, 1985),
provided by multi-wavelength imaging.
Following the pioneering work of Baum (1962) and Koo (1985), Fernández-Soto et al (1999) have shown that it is possible to reliably estimate redshifts using CCD images at different wavebands - the so called photometric redshifts -. This technique is particularly useful when mapping the very distant universe because galaxies in deep surveys could not be spectroscopically observable. Bayesian techniques have been introduced to improve the accuracy of the photometric redshift estimation (Benítez, 2000).
Different surveys reaching extremely large depths are providing us with the possibility of analyzing the evolution of clustering with cosmic time. We can mention the COMBO17 survey (Classifying Objects by Medium-Band Observations) which lists photometry in 17 passbands (Wolf et al., 2004), the Calar Alto Deep Imaging Survey (CADIS), used by Phleps and Meisenheimer (2003) to show how the clustering strength grows from z = 1 to the present epoch and its dependence on morphological type, and the recently released Great Observatories Origins Deep Survey (GOODS) described in Giavalisco et al. (2004). The SDSS provides also photometric information in five bands allowing the measurement of photometric redshifts for a volume-limited sample containing more than 2 million galaxies within the range 0.1 < z < 0.3. Analyzing the angular two-point correlation function of this survey, Budavárí et al. (2003) have found an interesting bimodal behavior between red elliptical-like galaxies and blue galaxies.
The recent project named the ALHAMBRA-survey (Advanced Large,
Homogeneous Area Medium Band Redshift Astronomical survey) is being
carried out by Moles and collaborators using the 3.5m Calar
Alto telescope. The photometric survey will cover an area of
eight square degrees. Imaging will be performed using 20 optical
filters plus three standard bands in the near infrared. It is
expected to collect about 600,000 photometric galaxy redshifts
with an accuracy of
 z <
0.015(1 + z). This photometric survey, midway between the
wide-angle spectroscopic surveys and the narrow imaging surveys, is
deep enough and wide enough to be extremely useful for
all kind of studies involving cosmic evolution.
z <
0.015(1 + z). This photometric survey, midway between the
wide-angle spectroscopic surveys and the narrow imaging surveys, is
deep enough and wide enough to be extremely useful for
all kind of studies involving cosmic evolution.