


E. Fractal descriptors of clustering
None of the previous descriptors is motivated by the requirement that the galaxy distribution should, in some sense, be scale free, which might be expected on the grounds that the gravitational force which drives the clustering is scale free. What one would like to do is to generate a set of scaling indices that describes, say, the scaling of the moments of the galaxy counts distribution with cell size.
This was in a sense achieved by Gaztañaga (1992, 1994) when he determined the scaling laws of restricted N-point correlation functions. However, one might argue that the scaling of some high order correlation function has less immediate intuitive appeal than the scaling of the moments of cell counts.
There is a formalism for describing moments of cell counts that is commonly used when describing fractal point sets that was adopted as a clustering descriptor by Martinez et al. (1990). If it is possible to determine a set of such scaling indices we can turn the argument around and say that, over the range of scales where scaling is observed, the galaxy clustering can be represented by a fractal of a given type.
One should be aware that having a power law correlation function is not necessarily an indication of scale invariance! Conversely, the fractal description implies no particular underlying physical process: it is merely a statement of how moments of counts in cells behave as a function of cell size.
It is an interesting question of physics to formulate the physical process that might generate this distribution of scaling indices. This has been attempted by Jones (1999) for a simple nonlinear gravitational clustering model.
There is a considerable difference between using the concept of fractal measure to describe a statistical process in some particular regime and saying "this distribution is such-and-such a fractal". There has been a set of papers observing scaling of a low order correlation function and jumping to the conclusions that (a) this scaling law holds at all scales (Sylos Labini et al., 1998) and (b) this scaling law must be a consequence of some exotic phenomenon (Bak and Chen, 2001).
In the first case scaling laws can only be expected to hold over scales where nonlinear gravitational clustering has been at work. In the linear regime we merely see a reflection of the initial conditions: these have been revealed to us by the COBE experiment and by other microwave background anisotropy measurements. Indeed, it is a prediction of gravitational clustering theory that there should be a break in the scaling laws that reflect the transition between the linear and nonlinear regimes. We expect to see this as the transition to homogeneity that must occur on large scales.
There is no way out of this: the COBE results tell us that there will be large scales where the Universe is almost homogeneous.
In the second case there is absolutely no indication that anything more exotic than the force of gravitation is involved in the growth of clustering. On the contrary, the manifest successes of gravitational N-body experiments testify to the adequacy of gravity. We are not observing a critical phenomenon, nor are we on the verge of some marginal instability.
2. Structure from counts in cells
The first analyses of galaxy sky maps were done by dividing the sky into cells and counting the cell occupancy. As mentioned earlier, Bok (1934) and Mowbray (1938) established the non-uniformity of the galaxy distribution by counting galaxies in cells, and later Rubin (1954), Limber (1954), and Totsuji amd Kihara (1969) used the Lick catalog published as cell counts in 1° cells. Peebles used the unpublished higher resolution data from the original notes of Shane and Wirtanen. Today, cell counts still provide an important mechanism for analysing point distributions since they are easier to deal with than the raw, unbinned, data.
3. Scaling properties of counts in cells
Whether we evolve a model numerically or make some analytic
approximation it is necessary to characterize the clustering that
develops in a quantitative manner. Conventionally, this is done
by presenting the two-point correlation function
 (r) for the
mass distribution. However, by itself this does not fully
characterize the distribution of points. An important alternative
is to look at the distribution of counts in cells as a function of
cell size.
(r) for the
mass distribution. However, by itself this does not fully
characterize the distribution of points. An important alternative
is to look at the distribution of counts in cells as a function of
cell size.
The relationship between the probability PN(V)
of finding N galaxies in a sample volume V and the
correlation functions of all orders was given by
White (1979).
The expression is not
of any real use unless all correlation functions are known, or if
there is a known relationship between them.
Fry (1984a) and
Balian and Schaeffer
(1989a)
computed the properties of the
counts-in-cells distribution PN(V) on the
hypothesis that the
correlation functions of all orders form a particular scaling
hierarchy in which the qth order correlation function
q
based on a q-agon of points ri scales as
 |
(34) |
The hierarchy is described by a single scaling index
 .
The data available at the time, the CfA survey, appeared
to support both the form of PN(V) and this
scaling hypothesis.
.
The data available at the time, the CfA survey, appeared
to support both the form of PN(V) and this
scaling hypothesis.
The special case of P0(V) is the "Void Probability Function" (VPF), that is the probability of a volume V containing zero galaxies. One can construct the probability distribution for having a void of a given size V in a distribution of galaxies with given correlation properties (Fall et al., 1976). It is given by White (1979)
 |
(35) |
with
 |
(36) |
Here n0 is the mean space density of galaxies (or clusters), and wi is the i-point correlation function of (i - 1) coordinates and is determined on linear scales by (among other things) the power spectrum of the primordial density fluctuations. For purely Gaussian fluctuations the sum in a is cut off beyond the second term. However, gravitational evolution destroys the Gaussian character of fluctuations and we are thus forced to make an ansatz regarding the relationship between second and higher order correlation functions either through BBGKY hierarchies (Fry, 1984b) or by pure guess.
White (1979) shows the relation between P0(V) and the cell count probabilities PN(V). Different clustering models have been proposed based on particular choices for the counts in cells (Coles and Jones, 1991; Saslaw, 2000; Borgani, 1993). A particular - and rather popular - way of analyzing the statistical properties of point sets is through the possible scaling of the moments of the counts in cells as it is explained in next section. Alternatively, one can consider the scaling of moments of counts of neighbors (Martínez and Coles, 1994).
4. Quantifying structure using multifractals
Given a model for the development of galaxy clustering we might like to predict the resulting distribution of cell counts since this provides a straightforward way of confronting the model with data.
Denote by p(X;L) the probability that some quantity x takes on the value X when measured in a cell of size L. The distribution p can be characterized by its moments:
 |
(37) |
If for some monotonic function D(q) the moments scale with cell size L as
 |
(38) |
the point distribution is said to have scaling properties characterized by dimensions D(q). The exponent is written in this way since the case q = 1 corresponds to the total number of particles in the sample volume, which is obviously independent of the cell size. The case q = 2 is related to the variance of the cell counts and to the two-point correlation function.
Eq. 38 does not describe arbitrary point distributions, but it does describe a large and important set of such distributions that have the property of multifractal scaling (Borgani, 1995). It has been argued that the observed galaxy distribution and the distribution of particles in an evolved N-Body simulation exhibit multifractal scaling.
There is a slightly different way of getting at the scaling exponents D(q): via the partition function Z(q, r). Z(q, r) is related to the qth statistical moment of the distribution of points as viewed in cells of size r. Suppose the sample is drawn from a probability distribution p(n; r) for finding n galaxies in a randomly chosen cell of scale r. The qth moment of the cell occupancy is defined as
 |
(39) |
The partition function is then defined as
 |
(40) |
If ni(r) denotes the occupancy of the
ith cell in a partition of the sample space into
 r cells of scale
r, the sample estimate for the partition function is
r cells of scale
r, the sample estimate for the partition function is
 |
(41) |
where N is the total number of points
( ni(r)). Note
that the ordering of the cells is not important and so the
information on the relationship between neighbouring cells appears
through the r-dependence of Z(q, r).
ni(r)). Note
that the ordering of the cells is not important and so the
information on the relationship between neighbouring cells appears
through the r-dependence of Z(q, r).
The situation of interest is where, for all values of q, Z(q, r) is found to scale as a power law in r:
 |
(42) |
where  (q) is the
scaling index of the partition function; see, e.g.,
Martínez et
al. (1990).
The function D(q) defined in
this way is a measure of some generalised dimension of order q
for the distribution. This is simply a restatement of
Eq. 38. Since Eq. 40 tell us
Z
(q) is the
scaling index of the partition function; see, e.g.,
Martínez et
al. (1990).
The function D(q) defined in
this way is a measure of some generalised dimension of order q
for the distribution. This is simply a restatement of
Eq. 38. Since Eq. 40 tell us
Z  mq,
Eq. 37 and Eq. 39 are essentially the same.
mq,
Eq. 37 and Eq. 39 are essentially the same.
D(q) is the logarithmic slope of the moment generating function and of the partition function:
 |
(43)
|
In computing D(q) for a sample we would therefore expect to be able to see a reasonably straight line of data points in plot of either mq or Z(q, r) against r. Several aspects of finite-size data sample mitigate against this.
It should be noted that, technically, Eq. (42) needs be valid
only in the limit
r  0. This
limit is impossible to
take in the case of a discrete sample which is dominated by shot
noise at distances much smaller than the mean particle separation.
We can only ask for scaling over some well observed range.
Likewise, we are unable to reliably compute (41) for
large q since at large values of q the sum is dominated by
whatever happens to be the single largest cluster of points in the
sample.
0. This
limit is impossible to
take in the case of a discrete sample which is dominated by shot
noise at distances much smaller than the mean particle separation.
We can only ask for scaling over some well observed range.
Likewise, we are unable to reliably compute (41) for
large q since at large values of q the sum is dominated by
whatever happens to be the single largest cluster of points in the
sample.
An important feature of many statistical distributions is the phenomenon known as intermittency. Mathematically this describes a situation where the higher moments of the spatial distribution of some quantity dominate over the lower moments in a special way: there is an anomalous ratio between successive statistical moments as compared with a Gaussian process. The physical manifestation of this is that the quantity becomes spatially localised.
It is important to realize that, although we traditionally characterize the galaxy distribution via its two-point and three-point correlation functions, these have little or nothing to do with the visual appearance of the clustering pattern: voids, walls and filaments. These macroscopic features are manifestations of the fact that the higher order moments of the density distribution are dominant: the statistical distribution of galaxies is intermittent.
Intermittency can be quantified through a simple non-dimensional
function involving higher order statistical moments of the
distribution. Consider some random function of position
 (x)
having a non-zero mean and a statistical distribution whose moments
< q > are known . The
intermittency exponent µq is defined in
terms of the scaling properties of the moments by
(x)
having a non-zero mean and a statistical distribution whose moments
< q > are known . The
intermittency exponent µq is defined in
terms of the scaling properties of the moments by
 |
(45) |
where l is some fiducial length scale. The spatial
intermittency pattern is characterized by the q dependence of
this ratio of moments. It is well known that a quadratic q -
dependence of µq corresponds to a lognormal
distribution of
(eg.
Jones et al., 1993).
Notice that < q > is simply the moment
generating function for the process
(x), and
so the property of intermittency is a feature of the underlying
statistics.
The assumption that the individual moments scale as per Eq. (38) guarantees the existence of µq and in this case we have
 |
(46) |
Since the quantity < q > for q = 1 has no
scale dependence (it is the mean value for the field), Eqs.
(45) and (46) provide the scaling law of the
moments in the case of multifractal scaling:
 |
(47) |
µq is the standard notation for the intermittency
exponent. µq is also called
(q) in the
multifractal literature; as in Eq. (42).
People are generally familiar with the notion of simple scaling in
which a function of one variable is independent of the scale of
the variable. A power law is the prototypical example: if
n(r)
r then
rescaling
r s =
then
rescaling
r s =
 r
recovers the same power law behavior,
n(r)
s.
Only the amplitude and scale of the function have changed, the
shape is the same.
r
recovers the same power law behavior,
n(r)
s.
Only the amplitude and scale of the function have changed, the
shape is the same.
This kind of scaling can be expressed mathematically in a way that
is particularly relevant to the current discussion. Suppose that
p(X, L) is the probability of measuring a value
X for some
property of a system when the sample volume has been binned into
cells of size L. Then the property X is said to exhibit
"simple or finite scaling" when for some constants
 and
and

 |
(48) |
for some function g(x). In the jargon of fractals we say that the quantity X is distributed on a fractal with a single scaling index.
Following Kadanoff et al. (1989) we can define a more complicated kind of scaling, multifractal scaling, in which we have
 |
(49) |
Here X0 and L0 can be thought of as physical units in which the quantities X and L are to be measured.
It is, at first glance, not easy to comprehend what this equation
is telling us about how the the distribution of X looks!. Define
a local scaling index
by the equation
 |
(50) |
Since depends on the
realization of the value of X in a
cell of scale L,
is a possibly random, function of
position. This is why it is referred to as a local scaling
index. With this, the probability of finding a value X in a cell
of size L is just
 |
(51) |
We have power law scaling with cell size, but the scaling index
is an arbitrary
function of the quantity X and the cell size L.
These two forms Eq. (48) and Eq. (49) of scaling agree only when g(x) is a power law and f (x) is linear.
If we look only at points such that
in Eq. (51) has
some specific value, the distribution p(X, L) has
the form (48): the set of points with
= constant is
a simple fractal of dimension f
(). Since the set consists
of a range of values of
it can be called a multifractal, a set of intertwined simple
fractals having different dimensions (see Fig. 16).
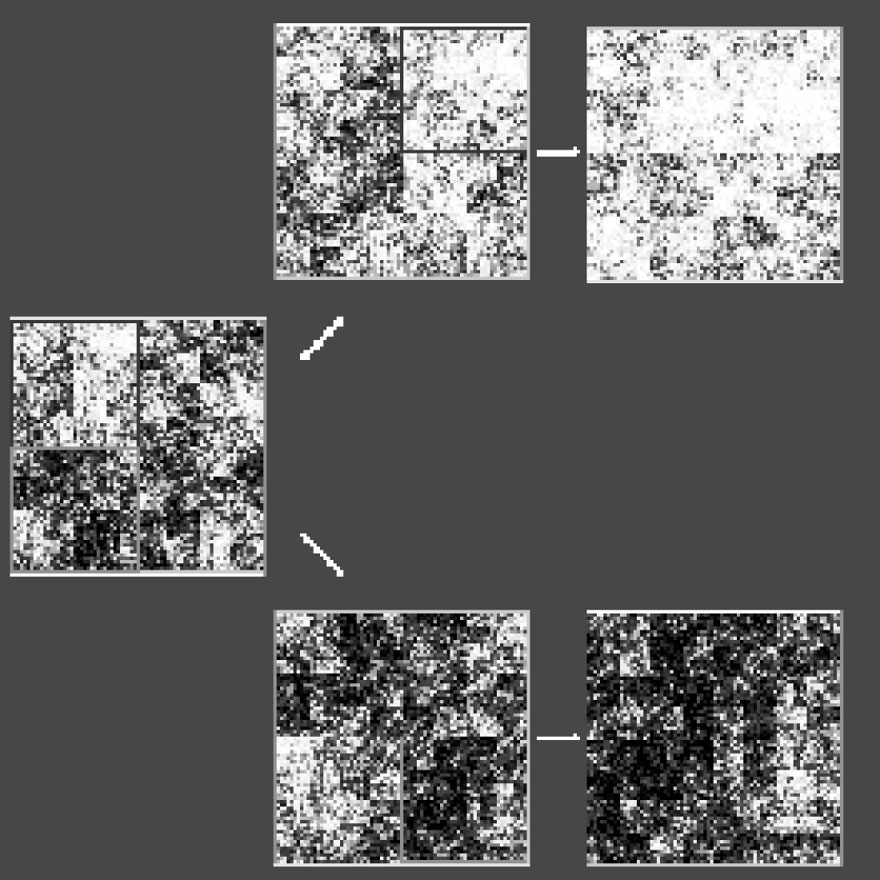 |
Figure 16. A multifractal mass distribution over a square of side L0. The distribution has been generated following a multiplicative cascade process (Martínez et al., 1990). The gray scale represents the quantity of mass (X) in each pixel. Successive enlargements of two different regions of the original plot illustrate the inhomogeneity of the mass distribution. |
Note, however, this cautionary tale. A set of points distributed
in power-law clusters is not necessarily a multifractal. It is
only a multifractal if the scaling indices
are themselves
constant on homogeneous fractal set. Thus not all point
distributions are multifractals, even if they are distributed in
power law clusters. A modified version of the scaling indices
formalism, the "weighted scaling indices", has been recently introduced
(Räth et
al., 2002).
This method allows us to statistically quantify the local morphological
properties of the galaxy distribution.
It can be shown that the descriptions of a point set via its
statistical moments (38) or via the distribution of its
scaling indices (51) are totally equivalent. The
functions f ()
and (q) are related
to one another via a Legendre transform
(Jones et al., 1992):
 |