


2.3. Spectrum
GRB are characterized by emission in the few hundred keV ranges with a non-thermal spectrum (see Fig. 3) X-ray emission is weaker - only a few percent of the energy is emitted below 10 keV and prompt emission at lower energies has not been observed so far. The current best upper limits on such emission are given by LOTIS. For GRB970223 LOTIS finds mV > 11 and provides an upper limit on the simultaneous optical to gamma-ray fluence ratio of < 1.1 × 10⁻⁴ [80]. Most bursts are accompanied, on the other hand, by a high energy tail which contains a significant amount of energy - E2N(E) is almost a constant. GRB940217, for example, had a high energy tail up to 18 GeV [81]. In fact EGRET and COMPTEL (which are sensitive to higher energy emission but have a higher threshold and a smaller field of view) observations are consistent with the possibility that all bursts have high energy tails [82, 83].
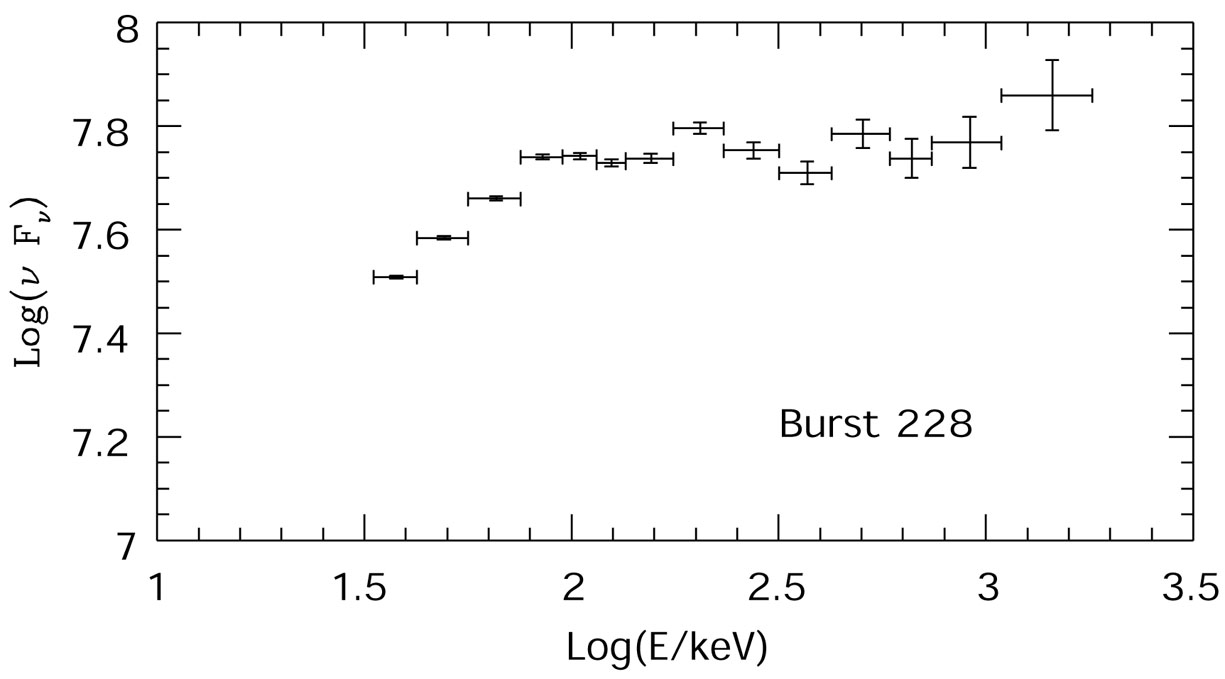 |
Figure 3. Observed spectrum of BATSE' burst 228. |
An excellent phenomenological fit for the spectrum was introduced by Band et al. [84]:
 |
(1) |
where H  (
( -
-
 )
E0.
There is no particular theoretical model that predicts this spectral
shape. Still, this function provides an excellent fit to most of the
observed spectra. It is characterized by two power laws joined
smoothly at a break energy H. For most observed values of
and
,
)
E0.
There is no particular theoretical model that predicts this spectral
shape. Still, this function provides an excellent fit to most of the
observed spectra. It is characterized by two power laws joined
smoothly at a break energy H. For most observed values of
and
,
 F
F
 2
N() peaks at
Ep = (
+ 2)E0 =
[( + 2) /
( -
)]
H. The "typical" energy of the observed radiation is
Ep. That is this is where the source emits the bulk of
its luminosity. Ep
defined in this way should not be confused with the hardness ratio
which is commonly used in analyzing BATSE's data, namely the ratio of
photons observed in channel 3 (100-300 keV) to those observed in
channel 2 (50-100 keV). Sometimes we will use a simple power law
fit to the spectrum:
2
N() peaks at
Ep = (
+ 2)E0 =
[( + 2) /
( -
)]
H. The "typical" energy of the observed radiation is
Ep. That is this is where the source emits the bulk of
its luminosity. Ep
defined in this way should not be confused with the hardness ratio
which is commonly used in analyzing BATSE's data, namely the ratio of
photons observed in channel 3 (100-300 keV) to those observed in
channel 2 (50-100 keV). Sometimes we will use a simple power law
fit to the spectrum:
 |
(2) |
In these cases the power law index will be denoted by
.
A typical spectra index is
 1.8 - 2
[85].
1.8 - 2
[85].
In several cases the spectrum was observed simultaneously by several
instruments. Burst 9206022, for example, was observed simultaneously
by BATSE, COMPTEL and Ulysses. The time integrated spectrum on those
detectors, which ranges from 25 keV to 10 MeV agrees well with a Band
spectrum with: Ep = 457 ± 30 keV,
= - 0.86 ± 0.15 and
= - 2.5
± 0.07
[86].
Schaefer et al.
[87]
present a complete spectrum from 2 keV to 500 MeV
for three bright bursts.
Fig. 4 shows the distribution of observed values of H in several samples [84, 88, 89]. Most of the bursts are the range 100 keV < H < 400 keV, with a clear maximum in the distribution around H ~ 200 keV. There are not many soft GRBs - that is, GRBs with peak energy in the tens of keV range. This low peak energy cutoff is real as soft bursts would have been easily detected by current detectors. However it is not known whether there is a real paucity in hard GRBs and there is an upper cutoff to the GRB hardness or it just happens that the detection is easiest in this (few hundred keV) band. BATSE triggers, for example, are based mostly on the count rate between 50 keV and 300 keV. BATSE is, therefore, less sensitive to harder bursts that emit most of their energy in the MeV range. Using BATSE's observation alone one cannot rule out the possibility that there is a population of harder GRBs that emit equal power in total energy which are not observed because of this selection effect [90, 89, 91, 92]. More generally, a harder burst with the same energy as a soft one emits fewer photons. Furthermore, the spectrum is generally flat in the high energy range and it decays quickly at low energies. Therefore it is intrinsically more difficult to detect a harder burst. A study of the SMM data [93] suggests that there is a deficiency (by at least a factor of 5) of GRBs with hardness above 3MeV, relative to GRBs peaking at ~ 0.5 MeV, but this data is consistent with a population of hardness that extends up to 2 MeV.
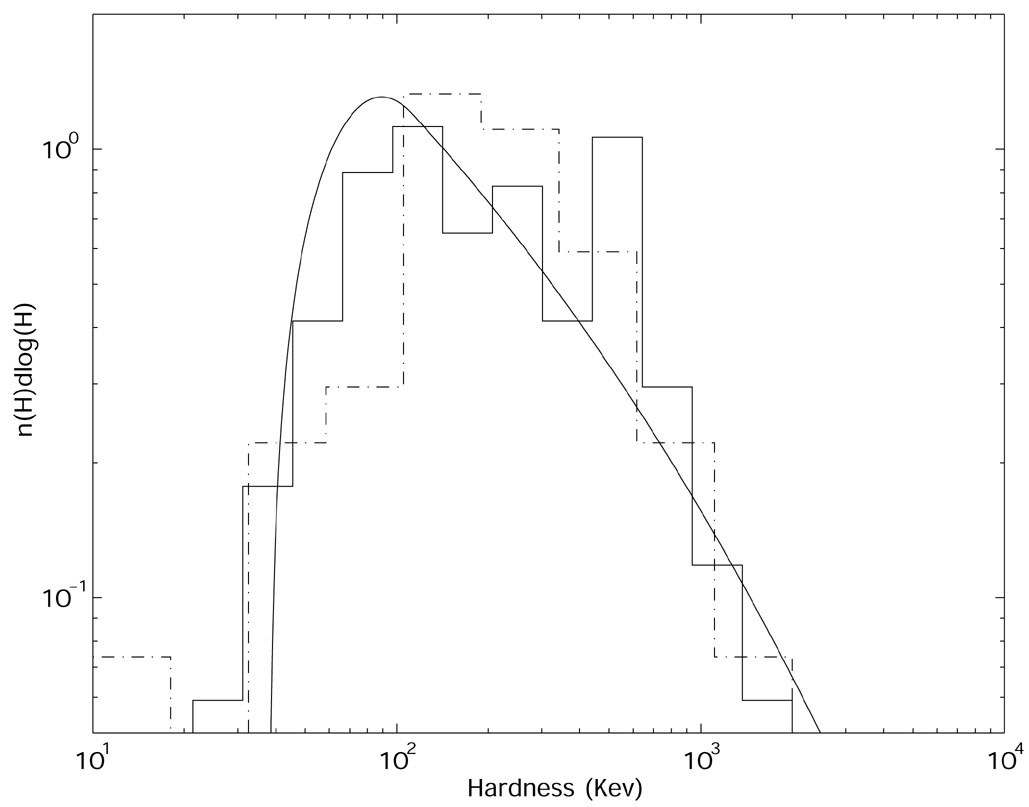 |
Figure 4. N(H) - the number of bursts with
hardness , H, in the Band et al.
[84]
sample (dashed-dotted line) and in the Cohen et al. sample
(solid line)
[89] togather with a
theoretical fit of a distribution above H = 120 KeV with
|
Overall the spectrum is non-thermal. This indicates that the source
must be optically thin. The spectrum deviates from a black body
in both the low and the high energy ends: The X-ray paucity constraint
rules out optically thick models in which the
 -rays could be
effectively degraded to X-rays
[94].
The high energy tails
lead to another strong constraint on physical GRB models. These high
energy photons escape freely from the source without producing electron
positron pairs! As we show later, this provides the first and most
important clue on the nature of GRBs.
-rays could be
effectively degraded to X-rays
[94].
The high energy tails
lead to another strong constraint on physical GRB models. These high
energy photons escape freely from the source without producing electron
positron pairs! As we show later, this provides the first and most
important clue on the nature of GRBs.
The low energy part of the spectrum behaves in many cases like a power
law: F
with - 1/2
< < 1/3,
[19,
95].
This is consistent with the
low energy tail of synchrotron emission from relativistic
electrons - a distribution of electrons in which
all the population, not just the upper tail, is
relativistic. This is a direct indication for the existence of
relativistic shocks in GRBs. More than 90% of the bright bursts
studied by Schaefer et al.
[87]
satisfy this limit. However, there may be bursts whose low
energy tail is steeper
[96].
Such a spectrum cannot be produced by a simple synchrotron emission
model and it is not clear how is it produced.