


3.3. Interpretation of the Peak Flux Distribution
The counts distribution or the Peak flux distribution of the bursts
observed by BATSE show a paucity of weak burst. A homogeneous count
distribution, in an Eucleadian space should behave like:
N(C)  C-3/2, where N(C) is the number of
bursts with more than C counts (or counts per second).
The observed distribution is much flatter
(see Fig. 10). This fact is
reflected by the low
<V / Vmax> value of the BATSE data: there are
fewer distant sources than expected.
C-3/2, where N(C) is the number of
bursts with more than C counts (or counts per second).
The observed distribution is much flatter
(see Fig. 10). This fact is
reflected by the low
<V / Vmax> value of the BATSE data: there are
fewer distant sources than expected.
The observed distribution is compatible with a cosmological distribution of sources. A homogeneous cosmological distribution displays the observed trend - a paucity of weak bursts relative to the number expected in a Eucleadian distribution. In a cosmological population four factors combine to make distant bursts weaker and by this to reduce the rate of weak bursts: (i) K correction - the observed photons are red-shifted. As the photon number decreases with energy this reduces the count rate of distant bursts for a detector at a fixed energy range. (ii) The cosmological time dilation causes a decrease (by a factor 1 + z) in the rate of arrival of photons. For a detector, like BATSE, that measures the count rate within a given time window this reduces the detectability of distant bursts. (iii) The rate of distant bursts also decreases by a factor 1 + z and there are fewer distant bursts per unit of time (even if the rate at the comoving frames does not change). (iv) Finally, the distant volume element in a cosmological model is different than the corresponding volume element in a Eucleadian space. As could be expected, all these effects are significant only if the typical red-shift to the sources is of order unity or larger.
The statistics
<V / Vmax> > is a weighted average of
the distribution N( > f ). Already in 1992 Piran
[56] compared
the theoretical estimate of this statistics to the observed one and
concluded that the typical redshift of the bursts observed by BATSE is
zmax ~ 1. Later Fenimore et al.
[200]
compared the sensitivity of PVO (that observes N( > f )
f-3/2) with the sensitivity of BATSE and concluded that
zmax(BATSE) ~ 1 (the maximal z
from which bursts are detected by BATSE). This corresponds to a peak
luminosity of ~ 1050 ergs/sec. Other calculations based on
different statistical methods were performed by Horack & Emslie
[186],
Loredo & Wasserman
[181,
182],
Rutledge et al.
[185]
Cohen & Piran
[183]
and Mészáros and collaborators
[187,
188,
189,
190]
and others. In particular Loredo & Wassermann
[181,
182] give an
extensive discussion of the statistical methodology involved.
Consider a homogeneous cosmological distribution of sources with a peak
luminosity L, that may vary from one source to another. It should be
noted that only the luminosity per unit solid angle is accessible by these
arguments. If there is significant beaming, as inferred
[25],
the distribution of total luminosity may be quite different. The sources
are emitting bursts with a count spectrum:
N( )
d = (L /
h
)
d = (L /
h  )
)
 ()
d, where
h, is the
average energy. The observed peak (energy) flux in a fixed energy range,
[Emin, Emax] from a source at a
red-shift z is:
()
d, where
h, is the
average energy. The observed peak (energy) flux in a fixed energy range,
[Emin, Emax] from a source at a
red-shift z is:
 |
(3) |
where dl(z) is the luminosity distance [184].
To estimate the number of bursts with a peak flux larger than f,
N( > f ), we need the luminosity function,
 (L,
z): the number of
bursts per unit proper (comoving) volume per unit proper time with a
given luminosity at a given red-shift. Using this function we can
write:
(L,
z): the number of
bursts per unit proper (comoving) volume per unit proper time with a
given luminosity at a given red-shift. Using this function we can
write:
 |
(4) |
where the red-shift, z(f, L), is obtained by inverting Eq. 3 and rp(z) is the proper distance to a red-shift z. For a given theoretical model and a given luminosity function we can calculate the theoretical distribution N(f ) and compare it with the observed one.
A common simple model assumes that
(L,
z) =  (L)
(L)
 (z) - the
luminosity does not change with time, but the rate of events per unit
volume per unit proper time may change. In this case we have:
(z) - the
luminosity does not change with time, but the rate of events per unit
volume per unit proper time may change. In this case we have:
 |
(5) |
The emitted spectrum,
N(), can be estimated
from the observed data. The simplest shape is a single power law (Eq. 2).
with  = 1.5 or
= 1.8
[85].
More elaborate studies have used the Band et al.
[84]
spectrum or even a distribution of such spectra
[185].
= 1.5 or
= 1.8
[85].
More elaborate studies have used the Band et al.
[84]
spectrum or even a distribution of such spectra
[185].
The cosmic evolution function
(z) and
the luminosity function
(L) are
unknown. To proceed one has to choose a functional
shape for these functions and characterize it by a few parameters.
Then using maximum likelihood, or some other technique, estimate these
parameters from the data.
A simple characterization of
(z) is:
 |
(6) |
Similarly the simplest characterization of the luminosity is as standard candles:
 |
(7) |
with a single parameter, L0, or equivalently zmax, the maximal z from which the source is detected (obtained by inverting Eq. 3 for f = fmin and L = L0).
There are two unknown cosmological parameters: the closure parameter,
 , and the
cosmological constant
, and the
cosmological constant
 . With the
luminosity function given by Eqs. (5) and (6) we have three unknown
parameters that determine the bursts' distribution: L0,
0,
. With the
luminosity function given by Eqs. (5) and (6) we have three unknown
parameters that determine the bursts' distribution: L0,
0,
 . We
calculate the likelihood function over this five dimensional
parameter space and find the range of acceptable models (those whose
likelihood function is not less than 1% of the maximal likelihood).
We then proceed to perform a KS (Kolmogorov-Smirnov) test to check
whether the model with the maximal likelihood is an acceptable fit
to the data.
. We
calculate the likelihood function over this five dimensional
parameter space and find the range of acceptable models (those whose
likelihood function is not less than 1% of the maximal likelihood).
We then proceed to perform a KS (Kolmogorov-Smirnov) test to check
whether the model with the maximal likelihood is an acceptable fit
to the data.
The likelihood function is practically independent of
in the range:
0.1 < < 1.
It is also insensitive to the cosmological constant
(in the range
0 < < 0.9,
in units of the critical density). This simplifies
the analysis as we are left only with the intrinsic parameters of the
bursts' luminosity function.
There is an interplay between evolution (change in the bursts' rate)
and luminosity. Fig. 9 depicts the likelihood
function in the (zmax,
) plane for
sources with a varying intrinsic rate.
The banana shaped contour lines show that a population whose rate is
independent of z
( = 0) is
equivalent to a population with an
increasing number of bursts with cosmological time
( > 0) with a
lower L0 (lower zmax). This tendency
saturates at high intrinsic evolution (large
), for which
the limiting zmax does not go below
 .5 and at very high
L0, for which the limiting
does not
decrease below -1.5. This interplay makes it difficult
to constraint the red shift distribution of GRB using the peak flux
distribution alone. For completeness we quote here "typical" results
based on standard candles, no evolution and an Einstein-DeSitter cosmology
[183].
.5 and at very high
L0, for which the limiting
does not
decrease below -1.5. This interplay makes it difficult
to constraint the red shift distribution of GRB using the peak flux
distribution alone. For completeness we quote here "typical" results
based on standard candles, no evolution and an Einstein-DeSitter cosmology
[183].
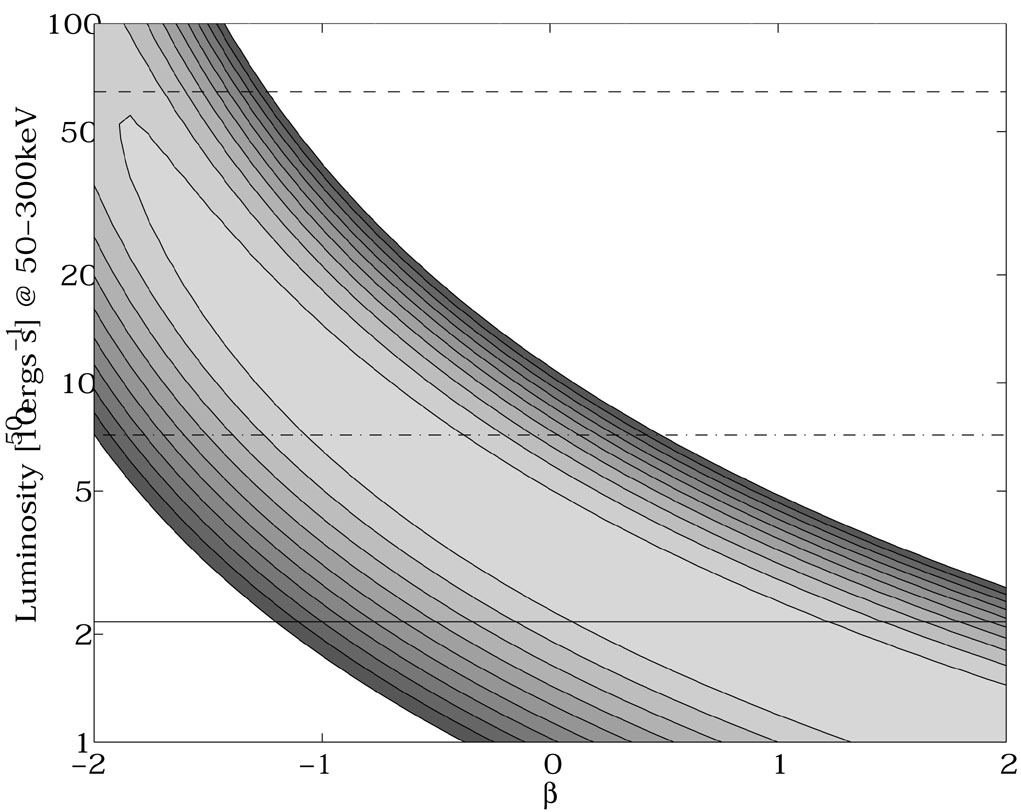 |
Figure 9. The likelihood function (levels
33%, 10%, 3.3% 1% etc..) in the
( |
Recall that
<V / Vmax> of the short bursts
distribution is rather close to the homogeneous Eucleadian value of
0.5. This means that when analyzing the peak flux distribution one
should analyze separately the long and the short bursts
[183].
For long bursts (bursts with t90 > 2 sec) the
likelihood function peaks at zmax = 2.1 (see
Fig. 10)
[183].
The allowed range at a 1% confidence level is:
1.4 < zmax < 3.1
(zmax(=2) = 1.5(+.7)(-.4) for
= 2). The maximal
red-shift, zmax = 2.1(+1.1)(-0.7),
corresponds, with an estimated BATSE detection efficiency of
0.3, to
2.3(+1.1)(-0.7) . 10-6
events per galaxy per year (for a galaxy density of
10-2 h3 Mpc-3;
[192]).
The rate per galaxy is independent
of H0 and is only weakly dependent on
. For
= 1 and
= 0 the typical
energy of a burst with an observed fluence, F, is
7(+11)(-4) . 1050(F /
10-7 ergs / cm2) ergs. The distance to the sources
decreases and correspondingly the rate increases and the energy
decreases if the spectral index is 2 and not 1.5. These numbers vary
slightly if the bursts have a wide luminosity function.
 |
Figure 10. The observed long burst peak
flux distribution
and three theoretical cosmological distributions with
|
Short bursts are detected only up to a much nearer distances: zmax(short) = 0.4+1.1, again assuming standard candles and no source evolution. There is no significant lower limit on zmax for short bursts and their distribution is compatible with a homogeneous non-cosmological one. The estimate of zmax(short) corresponds to a comparable rate of 6.3(-5.6) . 10-6 events per year per galaxy and a typical energy of 3(+39) . 1049 F-7 ergs (there are no lower limits on the energy or and no upper limit on the rate since there is no lower limit on zmax(short)). The fact that short bursts are detected only at nearer distances is also reflected by the higher <V / Vmax> of the population of these bursts [79].
Relatively wide luminosity distributions are allowed by the data [183]. For example, the KS test gives a probability of 80% for a double peaked luminosity distribution with luminosity ratio of 14. These results demonstrate that the BATSE data alone allow a variability of one order of magnitude in the luminosity.
The above considerations should be modified if the rate of GRBs trace
the SFR - the star formation rate
[193,
194,
195].
The SFR has been determined recently by two independent studies
[196,
197,
198].
The SFR peaks at
z ~ 1.25. This is a strongly evolving non monotonic distribution.
which is drastically different from the power laws considered so far.
Sahu et al.
[194]
find that
(z)
SFR(z)
yields N( > f ) distribution that is compatible with
the observed one
(for q0 = 0.2, H0 = 50
km/sec-1 Mpc-1) for a narrow
luminosity distribution with
L = 1051 ergs/sec. Wijers et al.
[195]
find that the implied peak luminosity is higher
L = 8.3 . 1051 ergs/sec and it
corresponds to a situation in which the dimmest bursts observed by BATSE
originate from
z 6!
= 1051 ergs/sec. Wijers et al.
[195]
find that the implied peak luminosity is higher
L = 8.3 . 1051 ergs/sec and it
corresponds to a situation in which the dimmest bursts observed by BATSE
originate from
z 6!
The direct red-shift measure of GRB970508 [14] agrees well with estimates made previously using peak-flux count statistics ([200, 182, 183]). The red-shift of GRB971214, z = 3.418, and of GRB980703, z = 0.966, and the implied luminosities disagree with these estimates. A future detection of additional red-shifts for other bursts will enable us to estimate directly the luminosity function of GRBs. It will also enable us to determine the evolution of GRBs. Krumholz et al. [199] and Hogg & Fruchter [128] find that with a wide luminosity function both models of a constant GRB rate and a GRB rate following the star formation rate are consistent with the peak flux distribution and with the observed redshift of the three GRBs.