


In this lecture we examine the role of cosmic backgrounds. First we make an important distinction. We are primarily concerned with extragalactic backgrounds composed of unresolved faint sources rather than the fairly isotropic microwave radiation that comes from the recombination of hydrogen. Such unresolved source background have played a key role in astrophysics.
The pattern of discovery outside the optical and near-infrared spectral windows often goes like the following; the background is first discovered by sensitive detectors which do not have the angular resolution to see if there is any fine structure from faint sources. There is then some puzzlement as to its origin: for example, does it arise from an unforeseen population of sources beyond those already counted? In this manner, the X-ray background was identified as arising from active galactic nuclei and the sub-mm background from dusty star-forming galaxies. In each case we are concerned with separating the counts of resolved sources to some detectability limit with the measured value of the integrated background. Key issues relate to the contribution of resolved sources and the removal of spurious (non-extragalactic) foreground signals. Excellent reviews of the subject have been provided by Leinert et al (1998), Hauser & Dwek (2001) and Kashlinksy (2005).
In our case, we are interested in extending source counts
of star forming galaxies beyond z
 6 and so the question of
a near-infrared extragalactic background signal is of greatest
relevance. The instruments concerned include cameras on
Hubble Space Telescope and Spitzer SpaceTelescope, but
other space missions such as COBE and the Infrared Telescope
in Space have provided important results.
To understand the distinction between the resolved and unresolved components of the background, it is helpful to derive some fundamental relations for galaxy counts.
In the magnitude system, the differential count slope
 with
increasing magnitude is
 |
where N(m) is the differential number of galaxies per unit sky area (e.g. deg-2) in some counting bin dm.
Now the contribution to the surface brightness of the extragalactic night sky from sources as a given magnitude m is:
 |
where the 0.4 factor arises from the relationship between flux and magnitude.
And the integrated surface brightness (the extragalactic background light, EBL) is obtained by extending this integral to infinitely faint limits, viz:
 |
The bolometric equivalent of the EBL is then
 I
I d
d . The EBL is often
alternatively expressed as EBL =

 I
I d
d .
.
Surface brightness is usually expressed in nW m-2
steradian-1 although very early articles refer to some
derivative of magnitudes deg-2. As infrared fluxes
are often expressed in Janskies (1 Jansky = 10-26 W
m-2 Hz-1, a
useful conversion is 1 nw m-2 ster-1 = 3000 /
 (µm)
MJy ster-1.
Examination of the above relation shows that if
 > 0.4,
the surface brightness
contribution from fainter sources outshines that of brighter ones and so
the EBL will diverge. By deduction, therefore, the maximum contribution
of resolved sources to the background will be where

 0.4. If the slope of
the counts turns down below 0.4 at some point, it may seem pointless to
speculate that there is much information from fainter unresolved
sources. In the case of searching for cosmic reionization however, where
the first sources may be a distinct population, continuity in the source
counts may not be expected. For this reason, the interesting quantity is
the difference between a measured EBL and the integrated contribution
from the faintest resolved sources.
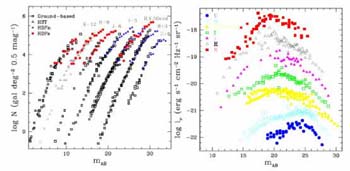 |
Figure 56. (Left) Differential galaxy
counts as a function of wavelength from the compilation of
Madau & Pozzetti
(2000).
Note the absolute numbers have been arbitrarily scaled for
convenience. (Right) Magnitude-dependent contribution of the counts to
the surface brightness
i |
Madau & Pozzetti
(2000)
present a careful analysis of the deep optical and near-infrared
counts at various wavelengths, mostly from Hubble Space Telescope data prior
to the Ultra Deep Field (Figure 56).
Extrapolation of the counts enables the contribution to the integrated
light from known populations to be evaluated as a function of
wavelength. The total EBL from this analysis is 55 nW m-2
sr-1 of which the dominant component lies longward of 1
µm. However, it must be remembered that
galaxies are extended objects and so it is possible that significant
light is lost in the outermost regions of each. As surface brightness is
relativistically dimmed by the cosmic expansion,
 (1 +
z)4, the contribution from
distant sources could be seriously underestimated
(Lanzetta et al 2002).
In a similar fashion to the check we made that the integrated star formation history produces the present stellar mass density (Lecture 4), so it is possible to verify that the bolometric output from stellar evolution should be consistent with the present mass density of stars.
The bolometric radiation density
 bol(t) is
 |
where
 s is
the star formation rate per comoving volume.
The integrated EBL is then
 |
The check is a little bit trickier because a typical star formation history has to be assumed and presumably there is a large variety for different kinds of sources observed at various redshifts. The issue is discussed in detail by Madau & Pozzetti.
8.3. Recent Background Measurements
The goal for making extragalactic background light (EBL) measures is thus to determine the extent to which the measured value (or limit) exceeds that predicted from extrapolation of the galaxy counts. This might then provide some evidence for a new distant population such as the sources responsible for cosmic reionization.
Various claims of an excess have been made in the 0.3 to 10 µm wavelength region (Figure 57). Outside of this window the background appears to be entirely produced by known sources. Such EBL measurements are extremely difficult to make for several reasons. An accurate absolute calibration is essential since the interesting signal is a `DC difference' in surface brightness. The removal of spurious foregrounds is likewise troublesome: at some wavelengths, the foreground signal greatly exceeds the sought-after effect.
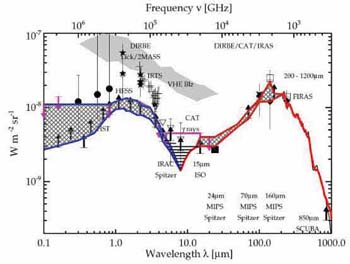 |
Figure 57. Summary of recent measures of the extragalactic background light from the compilation of Dole et al (2006). The cross-hatched region represents the region of claimed excess between the various background meaasures (labelled points) and the lower limits to the integrated counts (shown as upward arrows in the critical optical-near IR region). Interesting excesses are found in the 0.3 to 5 µm region. |
In the optical window, careful experiments have been undertaken by Mattila (1976), Dube et al (1979) and most recently Bernstein et al (2002). The most vexing foreground signals at optical wavelengths arise from airglow (emission in the upper atmosphere which has a time-dependent structure on fine angular scales), zodiacal light (scattering of sunlight by interplanetary dust which varies with the motion of the Earth along the ecliptic plane) and diffuse Galactic light or `cirrus' (gas clouds illuminated by starlight). The wavelength dependence of these foregrounds (including the microwave background itself which is considered a `contaminant' in this respect!) is summarized in Figure 58. For the critical near-infrared region where redshifted light from early sources might be detected, airglow and zodiacal light are the dominant contaminants.
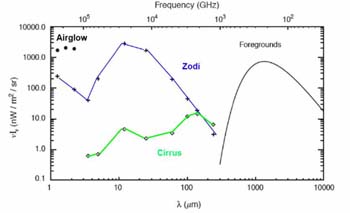 |
Figure 58. Wavelength dependence of the dominant foreground signals from the compilation by Kashlinsky (2005). Airglow and zodiacal light dominate at the wavelengths of interest for stellar radiation from highly redshift sources. |
Experiments have differed in the way these foregrounds might be removed. The use of a space observatory avoids airglow and observations at different Galactic latitudes can be used to monitor or minimize the effect of cirrus. Zodiacal light, the dominant foreground for all mid-infrared studies and all space-based near-infrared studies, is the most troublesome.
To first order, the zodiacal light can be predicted depending on the geometrical configuration of the ecliptical plane, the earth, sun and target field. Although seasonal variations can be tracked and the spectrum of the zodiacal light is solar, imponderables enter such as the nature and distribution of the interplanetary dust and its scattering properties.
The positive EBL excess measures at optical to near-infrared wavelengths have remained controversial. This is because all such experiments search for a `DC signal' - a small absolute difference between two signals within which foregrounds have to be painstakingly removed. A brief study of the Bernstein et al (2002) experiment will make the difficulties clear.
Bernstein et al (2002) claim a significant optical excess at 300, 550 and 800nm from fields observed with Hubble's WFPC-2 and FOS. Airglow is elminated since HST is above 90km and sources were removed in each HST image to VAB = 23.0. The zodiacal light spectrum was measured simultaneously with a ground-based optical telescope and iteratively subtracted from the HST data.
At 550nm, the total WFPC-2 background measured after removing
all sources was 105.7 ± 0.3 units (1 unit = 10-9 cgs
ster-1 Å -1).
The measured zodi background was 102.2 ±0.6 units.
Galactic cirrus and faint galaxies beyond VAB = 23.0 were
estimated as 0.8 and 0.5 units respectively. The claimed excess
signal at this wavelength is 2.7 ± 1.4 units. Not only is this
only a 2  detection but
it would only require a 2%
error in the estimated Zodiacal light signal to be spurious.
Studies of the infrared background advanced significantly with the launch of the COBE satellite which carried DIRBE - a 10 channel photometer operating in the 1-240 µm range with 0.7 degree resolution chopping at 32Hz onto an internal zero flux surface, and FIRAS - an absolute spectrometer with 7 degree resolution operating in the 100 µm to 5mm range.
DIRBE measured the integrated background at 140 and 240 µm using an elaborate time-dependent model of the Zodiacal light (Kelsall et al 1998, Hauser et al 1998). Schlegel et al (1998) combined these data with higher resolution IRAS 100 µm maps to improve removal of Galactic cirrus and to measure the temperature of the dust emission. Finkbeiner et al (2000) extended the model of Zodiacal light to provide the first detection at 60 and 100 µm and Wright & Reese (2000) used 2MASS observations to improve Galactic source removal claiming a detection at 2.2 µm.
Dole et al (2006) have undertaken a very elegant analysis of 19000 Spitzer MIPS images. By centering the images on deep 24 µm sources, they can evaluate the statistical contribution of otherwise inaccessibly faint 70 and 160 µm sources.
Matsumoto et al (2005) has extended these detections to shorter wavelengths using a spectrometer onboard the Infrared Telescope in Space (IRTS). This signal has the tantalising signature of a distant star-forming stellar population - a steeply-rising continuum down to 1 µm and a discontinuity when extended to include optical data (Figure 57). Mattila (2006) has argued this signal represents an artefact arising from incorrect foreground removal. He has likewise criticised the Bernstein et al (2002) optical detections (Mattila 2003).
Supposing the DIRBE/2MASS/IRTS detections to be
real, what would this imply? Assuming the J-band background
(> 2.5 nW m-2 ster-1) arises from z
 9 Ly
9 Ly emission,
Madau & Silk (2005)
calculate the associated stellar mass
that is produced. They find an embarrassingly high production
rate, corresponding to
 *
= 0.045
  B;
in other words almost all the stars we see today would need to be
produced by z
  9
to explain the signal. Likewise the ionizing flux
produced by such star formation would be in excess of that
required to explain the WMAP optical depth.
Kashlinksky et al (2002,
2005)
have argued that the difficulties
inherent in extracting the EBL signal by the DC method may be alleviated by
considering the angular fluctuation spectrum
 F(
F( )
and its 2-D Fourier transform P2(q).
In more detail, the fluctuation in the measured background is
 |
and
 |
The success of the method depends on whether the various foreground contributions to P2(q) can be readily distinguished from one another. Although advantageous in using independent information from the DC measurements, it is unfortunately not easy to intercompare the experiments or to interpret the fluctuation analyses.
Kashlinksky et al (2005)
recently applied this method to deep IRAC
images. Sources were extracted to reasonably faint limits (0.3
µJy or mAB
 22-25). The pixels
associated with each image
were masked out in a manner that could be adjusted depending on
the significance of the source over the background and its area.
The data was split into two equal halves (A, B) and the power
spectrum of the signal (PS(q), S=A+B) was
compared to that of the noise (PN(q),
N=A-B). Figure 59 illustrates the
residual signal, PS(q) -
PN(q), and the fluctuations
(q2 P2(q) /
2
 )1/2 in 3 IRAC
fields as a function
of angular scale (2
 / q arcsec) in the four IRAC channels.
Although the positive fluctuations on small scales are consistent
with shot noise from the galaxy counts (solid lines in both panels),
the excess is particularly prominent on scales of 1-2 arcmin
and consistently in fields of various Galactic latitudes and
in all four IRAC bandpasses.
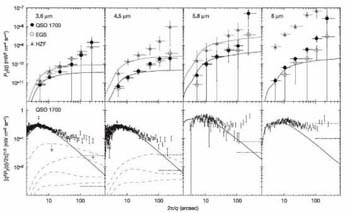 |
Figure 59. Detection of fluctuations in the
infrared background from the analysis by
Kashlinky et al (2005).
The upper panel shows the angular power
spectrum as a function of scale for 3 IRAC fields plotted for all four
IRAC channels (3.6 through 8 µm). The solid line shows the
effect of shot noise from the galaxy counts. This fits the fluctuations on
small scales but there is a significant and consistent excess
on large scales. Bottom panels refer to fluctuations for one
IRAC field plotted as (q2
P2(q) /
2 |
Kashlinksky et al argue that the excess signal is fairly flat
spectrally in  I
I ruling out any instrumental or
Galactic contamination. The constancy of the signal over the
wide range in Galactic latitude likewise suggests the signal
is extragalactic. However, zodiacal light is difficult to eliminate
as a contaminant. Although the signal persists when the Earth
is 6 months further around in its orbit, no analysis of the likely
zodi fluctuation spectrum is presented.
If the signal persists, what might it mean for sources fainter than 0.3 µJy? Without a detailed redshift distribution, it is hard to be sure. The clustering pattern is remarkably strong given the depth of the imaging data (much deeper fields have subsequently been imaged but no independent analyses have yet been published). In summary, this is an intriguing result, somewhat unexplained and in need of confirmation 8
8.5. EBL Constraints from TeV Gamma Rays
High energy (TeV) gamma rays are absorbed in the earth's atmosphere and converted into secondary particles forming an `air shower'. Cerenkov light is generated - a beam of faint blue light lasting a few × 10-9 sec is produced illuminating an area of 250m in diameter on the ground.
The significance of searching for TeV gamma rays is that they interact with the sea of 1-10 µm (infrared background) photons via the pair-creation process, viz:
 |
producing attenuation in distant sources (blazars) whose spectral energy distributions are assumed to be power laws.
 |
The strength of the attention, measured as a change in
 ,
for the most distant accessible blazars is thus a measure of the
degree of interaction between the gamma rays and the
ambient infrared background.
The HESS team (Aharonian et al 2006) have recently analyzed the gamma ray spectrum of a blazar at z = 0.186 and fitted its energy spectrum. As a result they can predict an upper limit to the likely infrared background for various assumptions (Figure 60). The constraint is most useful in the wavelength range 1-10 µm where the associated gamma ray spectral data is of high quality (top axis of Fig. 60). This new method is intriguing. Although in detail the constraint is dependent on an assumed form for the TeV energy spectrum of blazars, for all reasonable assumptions the acceptable background is much lower at 1-4 µm than claimed by the traditional experiments.
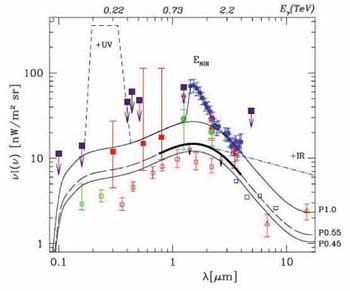 |
Figure 60. Constraints on the cosmic infrared background from the degree of attenuation seen in the high energy gamma ray spectrum of a distant blazar (Aharonian et al 2006). The black curves indicate likely upper limits to the infrared background for various assumptions. This independent method argues the near-IR detections by Matsumoto et al (2005, blue circles) and others are spurious. |
In this lecture we have learned that extragalactic background light measurements in principle offer an important and unique constraint on undiscovered distant source populations.
However, the observations remain challenging and controversial because of instrumental effects, related to the precision of absolute calibrations, and dominant foregrounds. In the 1-5 µm spectral regions positive detections in excess of extrapolations of the source counts have been reported. This is interesting because this is the wavelength range where an abundant and early population of faint, unresolved z > 10 sources would produce some form of infrared background.
At the moment, the claimed detections at 1-5 µm appear unreasonably strong. Too many stars would be produced by the star formation associated with this background signal and recent ultrahigh energy spectra of distant blazars likewise suggest a much weaker infrared background.
IRAC is a particularly promising instrument for the redshift range 10 < z < 20 and fluctuation analyses offer a valuable independent probe of the background, although it is hard to interpret the results and compare them with the more traditional DC level experiments.
Despite the seemlingly chaotic way in which the subject of the cosmic extragalactic background light has unfolded in the past decade, it is worth emphasizing that the motivation remains a strong one. Any information on the surface brightness, angular clustering and redshift range of radiation beyond the detected source counts will be very valuable information ahead of the discoveries made possible by future generations of facilities.
8 Recent developments are discussed by Sullivan et al., 2006 and Kashlinsky et al., 2006. Back.