


Sky surveys and so-called `deep fields' represent different strategies for studying extraterrestrial objects. There are no strict criteria distinguishing deep studies of selected areas and surveys. Guided by the characteristics of the most known projects, the following empirical definitions can be proposed.
Sky surveys include projects performing photometric
and/or spectral observations of a significant fraction of the sky
(the total coverage  104 sq. deg.). The effective depth of
surveys is z ~ 0.1 (here and below, z denotes redshift) or
several hundred megaparsecs (Mpc). Modern sky surveys are carried
out over several years by using, as a rule, middle-size
specialized telescopes.
104 sq. deg.). The effective depth of
surveys is z ~ 0.1 (here and below, z denotes redshift) or
several hundred megaparsecs (Mpc). Modern sky surveys are carried
out over several years by using, as a rule, middle-size
specialized telescopes.
Deep fields relate to projects devoted to a detailed
exploration of relatively small sky areas (the characteristic
field coverage is 10-3 - 101 sq. deg). Fields are
much deeper (z 0.5)
compared to surveys and observations are performed
with large telescopes. The typical exposures of a
deep field are 10-3 - 10-1 year.
`Integral' characteristics of some contemporary observational projects, many of which are discussed in detail below, are plotted in Fig. 2 in the plane B - lg S (a) and B - lg (N/S) (b), where B is the limiting magnitude of galaxies found in a survey or within a field in the B filter 2, S is the area on the sky (in square degrees), and N is the number of galaxies found.
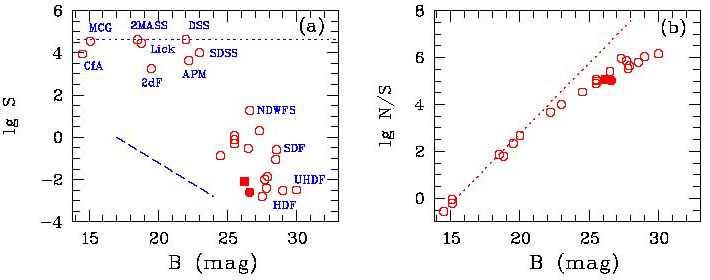 |
Figure 2. Characteristics of the main modern observational projects. The horizontal dotted line in Fig. (a) shows the total area of the sky. The black square and circle mark works performed with the 6-m SAO RAN telescope (see Section 4.9). |
Figure 2 clearly illustrates the formal
distinction introduced
above between surveys and deep fields: the characteristics of modern
projects are concentrated mostly in regions with S
 1 sq. deg. and
S 1000 sq. deg. This, of
course, must be a temporary situation, and
one can imagine a not-too-remote future when large fully robotic
telescopes will measure galaxies with B
1 sq. deg. and
S 1000 sq. deg. This, of
course, must be a temporary situation, and
one can imagine a not-too-remote future when large fully robotic
telescopes will measure galaxies with B
 25m -
30m over most of the sky (the top right in
Fig. 2a).
25m -
30m over most of the sky (the top right in
Fig. 2a).
The dashed curve in Fig. 2a shows the simplest
observational strategy with Elim / S = const
(Elim is the illumination
from the faintest objects detected). Such a dependence
between Elim and the area can be expected if observations
are carried out using one instrument with a fixed field of view
over a fixed total observation time. Big modern projects with
B 18m
show a steeper dependence in the B - lg S plane,
biased by the observations being made with larger telescopes
with a narrower, on average, field of view.
Figure 2b shows the surface density of galaxies (the
number of galaxies per square degree) as a function of the
limiting apparent magnitude of the project. (It should be
borne in mind that the limiting magnitude values are
determined differently by different authors.) This figure
demonstrates that the number of galaxies per square unit
continuously increases up to B
30m. The
old result obtained by Hubble
[7]
is also clearly seen: the observed number of
galaxies increases with the limiting magnitude more slowly
than is expected for a homogeneous distribution in Euclidean
space (the dotted line in Fig. 2b). The reasons
for such behavior of galactic counts are the expansion of the Universe
and the evolution of galaxies with time.
Figure 2b allows one to evaluate the number of
galaxies available for observation in the Universe. It can be seen that
the number of galaxies with B
30m is about
1.5 × 10⁶/sq. deg.
(i.e., one galaxy per each 3" × 3" square). Hence, the total
number of galaxies with B
30m is ~
1011.
The actual volume of the Universe probed in a survey or a deep field is determined, in addition to the deepness and area, by a selection function - a set of criteria used to select the objects. The most widespread methods of object selection are as follows [8]:
(1) Selection of all objects with a density flux above a fixed
threshold. The detection limit is set, as a rule, in fractions of
the standard deviation of the night sky brightness fluctuations. The
simplicity of this method allows a simple estimation of the space
volume probed. The maximum redshift (zmax) at which an
object with the proper (rest-frame) luminosity L is still
detectable at a given threshold
Elim can be inferred from the relation
L = Elim
4  DL2, where DL is the
photometric distance depending
on zmax. Then, the volume of a survey (deep field) is
DL2, where DL is the
photometric distance depending
on zmax. Then, the volume of a survey (deep field) is
 |
where the function Q depends on the cosmological model assumed
( m and
m and
 are
the relative contributions of matter
and vacuum energy to the total density of the Universe.)
are
the relative contributions of matter
and vacuum energy to the total density of the Universe.)
It should be noted that in practice, the selection is made using not the observed flux densities but, to a greater extent, the surface brightness of galaxies. For example, an object is often believed to be detected if its flux in several neighboring pixels in the CCD-image exceeds background fluctuations by several times. Naturally, this procedure is biased in favor of objects with a sufficiently high surface brightness.
(2) Selection by color indices. This method accounts for not only the observed flux but also the color indices, i.e., the relative energy distribution in the galactic spectra. It is widely applied to find the most distant galaxies, because their spectra show a distinctive break near the Lyman limit (912 Å) [9]. In the past, this approach proved to be extremely effective in discovering galaxies with ultraviolet excess (the Markarian galaxies) and galaxies with active nuclei (see, e.g., [10]). The calculation of the selection function and, correspondingly, the space volume probed by observations using this method is strongly dependent on the precise knowledge of the spectral energy distribution in the objects under study.
(3) Selection by narrow-band observations. The essence of
this method is the selection of galaxies that show an excess
when observed in narrow-band filters with respect to broad-band ones.
This method is used to search for objects with
emission lines (star-forming galaxies, active galactic nuclei).
Observations are performed with narrow filters cutting
spectral ranges 100
Å (to increase the contrast of the
emission object against the sky background) centered on the
wavelength (for example, L )
corrected for the expected redshift of a distant object. Clearly, in
this case, the selection function is determined by the equivalent width
of the emission line in the galaxy.
)
corrected for the expected redshift of a distant object. Clearly, in
this case, the selection function is determined by the equivalent width
of the emission line in the galaxy.
A shortcoming of this approach is that galaxies are searched for only in a very narrow interval of redshifts z and samples obtained in this way are relatively small. In addition, only a small fraction of all galaxies from this redshift interval is selected (namely, those that show a large equivalent width of emission lines). These reservations restrict obtaining statistically significant results on the general features of distant galaxies.
After the above comments, we turn to describing selected projects. Projects similar to those described below are currently being carried out at many observatories. Many dozens of papers discussing the results of both new and old surveys and deep fields are published each year. This diversity of projects can be quite confusing (especially because many projects have similar abbreviations). I therefore describe only the principal projects playing an outstanding role in modern astronomy.
The main goal of the following `technical' description (Sections 3 and 4) is to give the reader a flavor of the very rapidly growing observational base of modern astronomy. A distinctive feature of the last years is that the observational data obtained are freely available for the scientific community via the corresponding www pages.
2 In some cases, the limiting magnitude value was approximately estimated from data in other color bands. Back.