


Although bars are ubiquitous and might account for a significant fraction of a galaxy total luminosity, only recently studies dedicated to a more detailed modelling of the structural properties of bars started to come out more often (see e.g. [54, 78, 36]). This is partially because of the significant increase in complexity when one includes another component in the structural modelling of disc galaxies. These studies usually make use of the full data contained in 2D galaxy images, rather than only 1D surface brightness profiles, in order to obtain more accurate results. The rise in complexity thus usually means that automated procedures become much less reliable. In [36], BUDDA v2.1 [23] is used to individually fit galaxy images with model images that include up to three components: a Sérsic bulge, an exponential disc and a bar. Bars are modelled as a set of concentric generalised ellipses [8], with same position angle and ellipticity:
| (1) |
where x and y are the pixel coordinates of the ellipse
points, a and b are the extent of its semi-major and
semi-minor axes, respectively, and c is a shape parameter. Bars
are better described by boxy ellipses (i.e. with c > 2). The
surface brightness profile of the model bar is described as a Sérsic
profile, as bulges. The Sérsic index of bars
nBar is often in the range
 0.5-1,
with lower values representing flatter profiles. Another bar parameter
fitted by the code is the length of the bar semi-major axis
LBar, after which the bar light profile is
simply truncated and drops to zero.
0.5-1,
with lower values representing flatter profiles. Another bar parameter
fitted by the code is the length of the bar semi-major axis
LBar, after which the bar light profile is
simply truncated and drops to zero.
Similar fits were individually done to
1000 galaxies in a sample
carefully drawn from the Sloan Digital Sky Survey (SDSS - see
[42]).
The sample spans from elliptical
to bulgeless galaxies, with stellar masses above 1010
M (k-corrected
z-band absolute magnitudes
(k-corrected
z-band absolute magnitudes
 -20 AB mag), at a typical
redshift of 0.05, and includes
300 barred
galaxies. All galaxies are very close to face-on
(axial ratio
-20 AB mag), at a typical
redshift of 0.05, and includes
300 barred
galaxies. All galaxies are very close to face-on
(axial ratio  0.9) and do not show morphological perturbations,
thus assuring that dust extinction is minimised and that the sample is
suitable for image decomposition. This also avoids the uncertainties in
obtaining deprojected quantities. Fits were done in g, r
and i-band images. The distributions of several bar structural
parameters obtained in this work from the i-band images are shown
in Figs. 1 and 2.
0.9) and do not show morphological perturbations,
thus assuring that dust extinction is minimised and that the sample is
suitable for image decomposition. This also avoids the uncertainties in
obtaining deprojected quantities. Fits were done in g, r
and i-band images. The distributions of several bar structural
parameters obtained in this work from the i-band images are shown
in Figs. 1 and 2.
 |
 |
 |
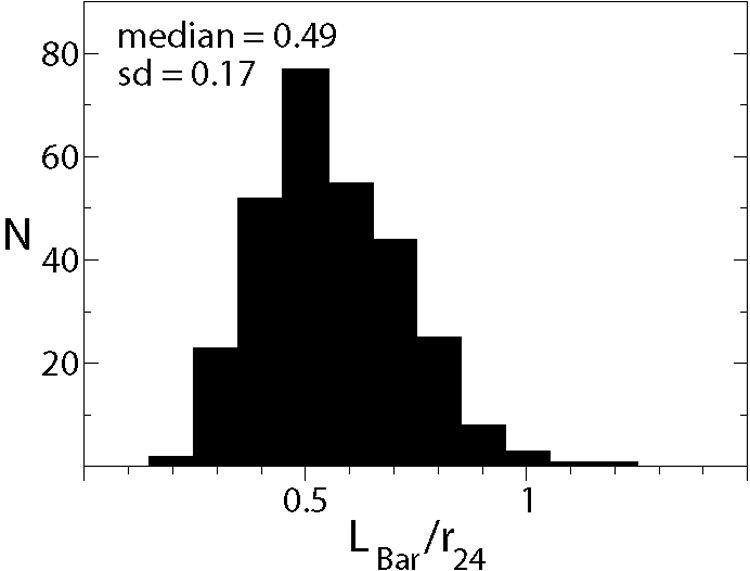 |
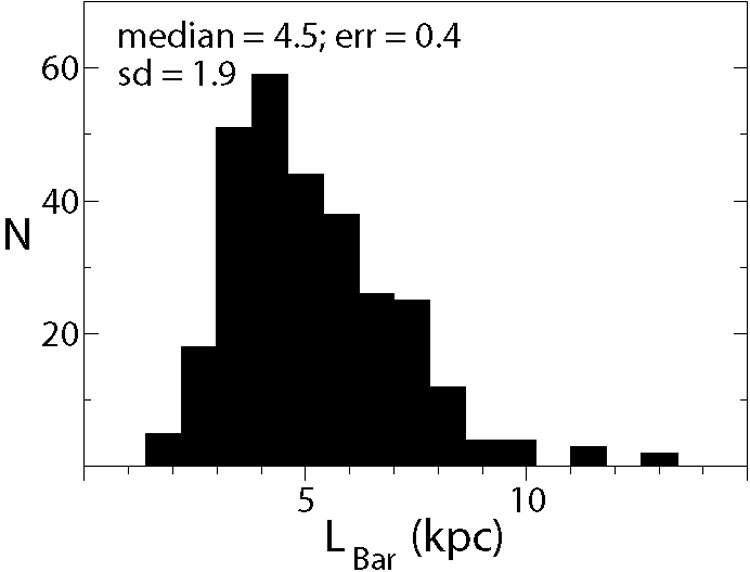
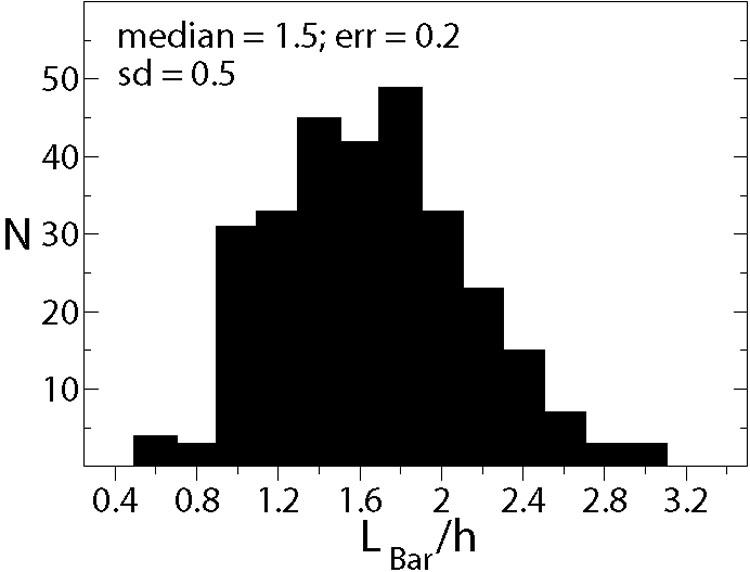
Figure 1. Distributions of bar
structural parameters obtained from 2D bar/bulge/disk i-band
image decomposition of
|
|
 |
 |
 |
|
Figure 2. Same as Fig. 1, but for bar-to-total luminosity fraction, bar Sérsic index, and bar boxyness [parameterised as c - see Eq. (1)]. |
|
Models of bar formation and evolution
should be in agreement with these results. Conversely, models where bar
properties are imposed can use these results as a guide in the
adjustment of the bar properties. One must note, however, that, due to
the relatively poor spatial resolution of the SDSS, these results are
biased against bars shorter than LBar
2-3 kpc, typically
seen in very late type spirals (later than Sc
[25]).
These results are thus
representative of the prototypical, bonafide bars seen mostly in early
type spirals (earlier than Sc) and lenticulars. Interestingly, the
median bar ellipticity is
20% higher than the
value found via ellipse fitting to galaxy images in
[59].
This is exactly what was predicted in
[36]
as ellipse fits
systematically underestimate the true bar ellipticity due to the
dilution of the bar isophotes by the rounder, axisymmetric light
distribution of bulge and disc. When fitting ellipses to galaxy images
one does not separate the contributions to the total galaxy light
distribution from the different components, but this is done in image
fitting with different models for each component. This shows that
results based on the ellipticity of bars measured via ellipse fitting
should be considered with this caveat in mind. For instance, there is an
indication from ellipse fits that, for faint galaxies, disk-dominated
galaxies have more eccentric bars than bulge-dominated galaxies
[9].
It it is not clear, however, if
this result holds if the axisymmetric light contribution from bulge and
disk is taken into account. Figure 1 also shows
that most of these bars have a semi-major axis between 3 and 6 kpc (but
with a long tail to longer bars), and that bars do not extend further
than 3 times the disc
scalelength h, or
1r24 (the radius at which the galaxy surface
brightness reaches 24 mag arcsec-2 in the r-band
- see also
[29]).
Figure 2 shows that a typical bar is responsible for
10% of the total
galaxy light, and has a quite flat luminosity
profile. Interestingly, one also sees that, indeed, bars have very boxy
shapes.
These data also reveal interesting
correlations. The left-hand panel in Fig. 3 shows a
correlation between bar ellipticity and boxyness, i.e. more eccentric
bars are also more boxy. Both quantities contribute to the strength of
the bar. Thus, the product of both,
 × c,
can be used as a
measure of bar strength. The right-hand panel shows that the effective
radius of the bar, normalised by r24, is correlated
with ×
c (see also
[65]).
Thus, longer bars are thinner and
stronger, as expected from the theoretical models mentioned above. The
left-hand panel in Fig. 4 shows that the length of
the bar, normalised by r24, is correlated with the
bulge-to-total ratio of the galaxy. Considering these results and the
theoretical expectations together, they indicate that bars grow longer,
thinner and stronger with age, as a result of angular momentum exchange,
and that bars have had more time to evolve in galaxies with more massive
bulges. In fact, the right-hand panel in Fig. 4
shows that the normalised effective radii of bars and bulges are
correlated (see also
[6]).
Hence, the growth of bars and bulges seems to be somehow connected. Through
different paths, these conclusions are also reached by others
[87,
27].
A more thorough analysis of these data will be published elsewhere.
× c,
can be used as a
measure of bar strength. The right-hand panel shows that the effective
radius of the bar, normalised by r24, is correlated
with ×
c (see also
[65]).
Thus, longer bars are thinner and
stronger, as expected from the theoretical models mentioned above. The
left-hand panel in Fig. 4 shows that the length of
the bar, normalised by r24, is correlated with the
bulge-to-total ratio of the galaxy. Considering these results and the
theoretical expectations together, they indicate that bars grow longer,
thinner and stronger with age, as a result of angular momentum exchange,
and that bars have had more time to evolve in galaxies with more massive
bulges. In fact, the right-hand panel in Fig. 4
shows that the normalised effective radii of bars and bulges are
correlated (see also
[6]).
Hence, the growth of bars and bulges seems to be somehow connected. Through
different paths, these conclusions are also reached by others
[87,
27].
A more thorough analysis of these data will be published elsewhere.
 |
 |
Figure 3. Left: correlation between the bar ellipticity and boxyness. Right: correlation between the effective radius of the bar normalised by r24 and the product of the bar ellipticity and boxyness. |
|
 |
 |
Figure 4. Left: correlation
between the length of
the bar normalised by r24 and the bulge-to-total ratio
of the galaxy. Right: correlation between the effective radius of the
bar and the effective radius of the bulge, both normalised by
r24. The top panel shows all bars, the middle panel
shows bars with ellipticity < 0.7, and the bottom panel shows bars
with ellipticity |
|
 error of a single
measurement, when available. Bin sizes are
error of a single
measurement, when available. Bin sizes are