Copyright © 2005 by Annual Reviews. All rights reserved
| Annu. Rev. Astron. Astrophys. 2005. 43:
677-725 Copyright © 2005 by Annual Reviews. All rights reserved |


3.1. Molecular Gas Mass and Star Formation Efficiency
The intrinsic line luminosities given in
Table 1 have been corrected
for magnification for those sources with known lensing and published
estimates of the magnification. For
sources without apparent lensing we have adopted the measured line
luminosity (assumed the magnification
µ = 1) in the figures and discussion of this section. The CO
line luminosity of EMGs covers a wide range of
L'CO = (0.3-16) × 1010
K km s-1 pc2. Not surprisingly, because this is
basically a flux-limited sample, the lowest line luminosities
occur for sources (primarily QSOs) with high magnification. The average
CO line luminosity is ⟨log (L'CO)⟩
= 10.45 ± 0.47
corresponding to an average gas mass of 2.3 × 10¹⁰
M using
using  = 0.8.
There is little difference between the average CO luminosities among the
three categories of sources QSOs, SMGs, and radio galaxies.
= 0.8.
There is little difference between the average CO luminosities among the
three categories of sources QSOs, SMGs, and radio galaxies.
Figure 6 shows the CO line luminosity (for the lowest J transition for which data exist) as a function of redshift for EMGs and samples of ULIRGs, luminous IR galaxies (LIRGs), and normal spirals. In comparison with EMGs the average line luminosity for ULIRGs in the local Universe is smaller by about a factor of 3 and with a much smaller range, log (L'CO) = 9.98 ± 0.13 (Solomon et al. 1997). However, there is significant overlap between CO luminosities from these high-z galaxies and those in the local Universe including ULIRGs, LIRGs, and even some normal spirals. For example, the ULIRG 20087-0308 has a CO line luminosity of 1.8 × 10¹⁰ K km s-1 pc2, larger than that of approximately one third of the EMGs. Local interacting galaxies with much more modest IR luminosities such as Arp 302 also have CO luminosities close to the midrange found in EMGs. The normal, isolated spiral NGC3147 has a CO luminosity of 0.7 × 10¹⁰ K km s-1 pc2, larger than six of the EMGs. Most normal, large spiral galaxies have a CO luminosity about a factor of 5-10 less than that of ULIRGs and 10-30 times less than that of EMGs.
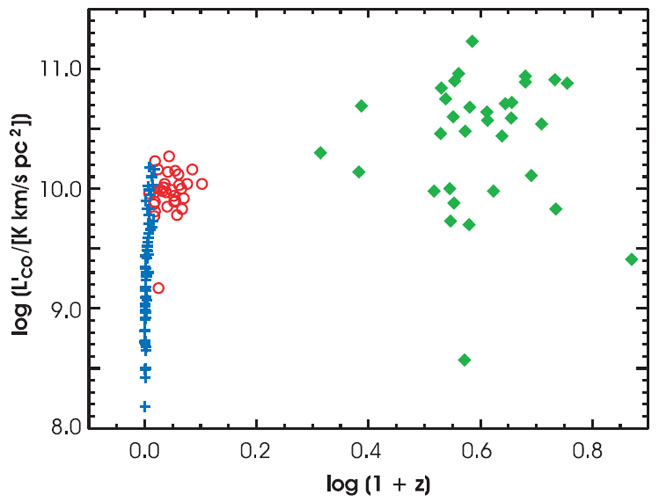 |
Figure 6. CO Luminosity: logL'CO versus log(1 + z) for local galaxies with LFIR < 1011.8 (blue crosses), ULIRGs (red circles), and EMGs (green diamonds). Although the EMGs are a flux-limited sample, the large scatter among the EMGs shows that they are much more diverse in CO luminosity and three times stronger in the mean compared with ULIRGs. The mean for ULIRGs and EMGs is 1 × 10¹⁰ and 3 × 10¹⁰ K km s-1pc2, respectively. All EMG luminosities with known lensing are corrected for magnification. |
Assuming a constant conversion factor, EMGs have on average a higher
molecular gas mass than the most gas-rich local Universe galaxies, but
only a few times higher. In the local
Universe there appears to be a "ceiling" for ULIRGs with
Mgas < 2 × 10¹⁰
M.
Approximately two-thirds of the EMGs lie above this local maximum with a
typical gas mass of 5 × 10¹⁰
M. (about 30
times the molecular mass of the Milky Way) This difference
between local and high-redshift gas masses may be important in
understanding the nature of the high-z galaxies and early galaxy
evolution. One possibility is that EMGs have the
same molecular gas mass as do ULIRGs but have a lower CO to
H2 conversion factor. Or, they may have the same conversion
factor and thus contain more molecular mass, possibly distributed over a
larger disk. We assume the conversion factor is
the same here and in the following sections.
The ratio of FIR luminosity to CO luminosity, LFIR
/ L'CO is an indicator of the star
formation rate per solar mass of molecular gas and is often taken as a
measure of the star formation efficiency
(Young, et al. 1986,
Solomon & Sage
1988).
Figure 7 shows this ratio as a function of
redshift. The star formation
efficiency for the EMGs at high z is similar to or slightly higher
than that for ULIRGs in the local Universe with an (logarithmic) average
LFIR / L'CO = 350; this translates
into a star formation
efficiency LFIR / Mgas =
430 L /
M.
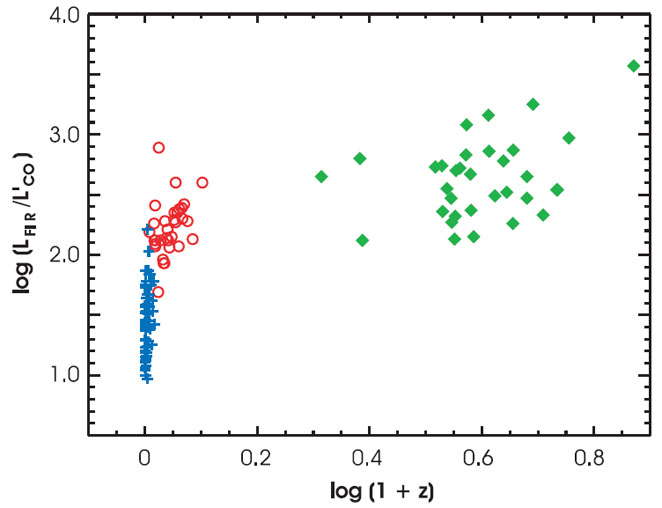 |
Figure 7. Star Formation Efficiency: log(LFIR / L'CO), an indicator of star formation efficiency, versus log(1 + z) for normal spirals including luminous but not ultraluminous galaxies (blue crosses), ULIRGs (red circles), and EMGs (green diamonds). ULIRGs and EMGs both have much higher star formation efficiency (SFE) than lower luminosity galaxies. EMGs have only a factor of two higher SFE on average than the EMGs, but there is substantial overlap even though the average FIR luminosity and star formation rate is 10 times higher for EMGs than ULIRGs. |
It is well known
(Sanders et al. 1988,
Sanders & Mirabel
1996,
Solomon & Sage 1988)
that the star formation efficiency of
ULIRGS, which are mergers and closely interacting galaxies, is higher
than that of normal spiral galaxies and there is a well-established
trend whereby star formation efficiency increases
with increasing FIR luminosity. Figure 8, which
shows log(LFIR) as a function of
log(L'CO) for normal spirals, LIRGs, ULIRGs, and EMGs,
extends the trend above 1013
L. The slope is
1.7, similar to that found without EMGs
(Gao & Solomon 2004).
This demonstrates that, given their high FIR luminosity, EMGs have the
high star formation efficiency expected by extrapolation from
low-redshift galaxies. Figure 8 also shows that
EMGs with the
same CO luminosity or molecular mass as ULIRGs also have the same (or
slightly higher) FIR luminosity and star formation efficiency. They do
not look like scaled-up versions of normal
spirals with a larger molecular mass. The high star formation
efficiency of luminous IR galaxies is due to a very high fraction of
dense molecular gas as traced by HCN emission
(Solomon, Downes &
Radford 1992c)
and other molecules, rather than the total molecular
gas mass traced by CO emission. In this sense, CO luminosity is not a
linear tracer of the star formation rate.
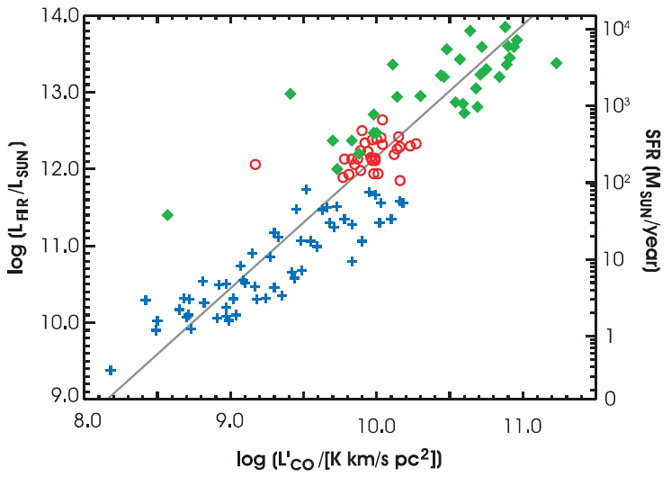 |
Figure 8. CO as a tracer of star formation rate: logLFIR and SFR versus logL'CO for normal spirals (blue crosses), ULIRGs (red circles), and EMGs (green diamonds). The solid line, a fit to all the points has a steep slope, logLFIR = 1.7 logL'CO -5.0, showing that total molecular mass indicated by CO luminosity is not a linear tracer of the star formation rate, indicated by FIR luminosity, when ULIRGs and EMGs are included. Excluding ULIRGS and EMGs the slope is 1.1. Unlike CO, HCN luminosity is a linear tracer of FIR luminosity and the star formation rate (see Section 3.2.1). |
3.2. Star Formation and Gas Depletion Lifetime
The high star formation efficiency of EMGs also implies a short star
formation lifetime. Taking the star formation rate to be given by 1.5
× 10-10 LFIR
[M
year-1], see for example
Kennicutt (1998),
and using the above star formation efficiency LFIR
/ L'CO = 350 and
= 0.8, the average star
formation rate per solar mass of
molecular gas  6
× 10-8 year-1. (This assumes that all FIR
luminosity is due to star formation) The
inverse is the average star formation lifetime or average gas depletion time
6
× 10-8 year-1. (This assumes that all FIR
luminosity is due to star formation) The
inverse is the average star formation lifetime or average gas depletion time
 SF = 16
My. Starbursts in EMGs are a brief but critical phase in galaxy
formation and evolution.
SF = 16
My. Starbursts in EMGs are a brief but critical phase in galaxy
formation and evolution.
Figure 9 shows the star formation lifetime of
normal spirals, ULIRGs, and EMGs as a function of FIR
luminosity. Because the mass conversion factor of CO to H2 is
larger for normal spirals than for ULIRGs,
is treated as a
parameter and the lifetime is normalized to
= 1. For normal
spirals = 4.6 and the
gas lifetime will be larger than indicated. For ULIRGs and, presumably,
EMGs, the lifetime is close to that indicated. Normal spirals with
dust-enshrouded star formation have gas depletion times in excess of
109 years, whereas ULIRGs and EMGS have lifetimes
in the range 107 to 108 years. For EMGs the lowest
level CO line observed has been used to determine the molecular gas
mass; to the extent that the CO (1-0) line luminosity
is higher than the (3-2) or (4-3) line the gas mass and lifetime will
be proportionally larger for some EMGs without CO(1-0) measurements. The
few available (1-0) measurements indicate
that this will be a small effect (less than a factor of 2) for most
sources.(This short lifetime also sets limits on the dimensions of the
starburst because the dynamical time must be less than the
starburst lifetime.)
 |
Figure 9. Star formation lifetime: star
formation lifetime |
3.3. HCN, [CI], & [CII] Emission
3.3.1. HYDROGEN CYANIDE: DENSE MOLECULAR GAS
HCN emission traces dense gas, n(H2) > 3 ×
104 cm-3 generally associated
with the star-forming cores of GMCs, whereas CO, with its low dipole
moment, can have emission excited by gas at the much lower densities
found in GMC envelopes. HCN line
luminosity is a much more specific tracer of star formation than CO
luminosity, although CO is a better overall tracer of total molecular
mass. In normal spirals and luminous infrared
galaxies (LIRGs and ULIRGs), the correlation between FIR luminosity
and HCN line luminosity is much tighter than that of FIR with CO line
luminosity
(Gao & Solomon 2004;
Solomon, Downes &
Radford 1992c).
The star formation rate deduced from the IR luminosity scales linearly
with the amount of dense
molecular gas traced by HCN emission over more than three orders of
magnitude in IR luminosity from 109.3 to 1012.3
L. This is not
the case for CO emission which shows much higher star
formation efficiencies, indicated by LFIR /
L'CO , for luminous IR galaxies than for normal
galaxies. In particular, ULIRGs have a star formation efficiency
or rate of star formation per solar mass of molecular gas that is, on
average, a five times higher than that of normal
galaxies. Luminous IR galaxies have a huge HCN line luminosity, large
mass of dense gas, and a high ratio of dense
gas to total molecular gas indicated by L'HCN /
L'CO ; for ULIRGs this luminosity ratio is typically 1/4
to 1/8, whereas for normal spirals it is in the range 1/25 to 1/40. The
ULIRG Mrk 231 often
regarded primarily as an AGN has a ratio L'HCN /
L'CO = 1/4 and an HCN luminosity much
larger than the CO luminosity of the Milky Way. This finding led
Solomon, Downes, &
Radford (1992c)
to conclude that even this galaxy
with a definite AGN had most of its bolometric luminosity supplied by
a starburst. This has recently been confirmed by near-IR spectroscopy of
the Mrk 231 starburst disk
(Davies, Taconi &
Genzel 2004).
All galaxies in the local Universe with global ratios
L'HCN / L'CO
 1/14 are luminous or ultraluminous IR starburst galaxies
(Gao & Solomon 2004).
1/14 are luminous or ultraluminous IR starburst galaxies
(Gao & Solomon 2004).
HCN observations of EMGs provide an important test of the star formation model. The fact that the ratio of IR luminosity to HCN luminosity in ULIRGs is the same as in lower luminosity normal spiral galaxies shows that ULIRGs, like the lower luminosity galaxies, are primarily powered by star formation and that the HCN line luminosity is a good measure of the mass of actively star-forming cloud cores (Gao & Solomon 2004; Solomon, Downes & Radford 1992b). The star formation that is responsible for the FIR emission has a rate that is linearly proportional to the HCN luminosity tracing the mass of dense molecular gas but not to the total molecular gas as traced by CO. HCN observations can address the question of whether EMGs have a sufficient mass of dense molecular gas to account for the huge IR luminosity by star formation.
HCN(1-0) emission has been detected from three EMG: the
Cloverleaf
(Solomon et al. 2003),
F10214
(Vanden Bout, Solomon
& Maddalena 2004),
and VCV J1409
(Carilli et al. 2004).
In all three cases, the HCN(1-0) line
luminosity is larger by a factor of 100 (or more) than that of normal
spiral galaxies and a few
times that of the ULIRG Arp 220, indicating the presence of a large
mass of dense molecular
gas. Based on the FIR luminosity (not the mid-IR from very hot dust) the
ratios LFIR / L'HCN =
1700 and 2700 for the Cloverleaf and F10214, respectively, are only
slightly higher than that of
Arp 220 or the average for local ULIRGs. The dense
gas fraction
indicators L'HCN / L'CO =
1/14 and 1/6, respectively, denote starbursts in both systems.
Detailed discussions of the HCN in these two objects are given in
Section 2.4. The third
detection VCV J1409 shows not only the highest HCN luminosity
(assuming no magnification by a gravitational lens) but also a somewhat
higher LFIR / L'HCN = 4000,
approximately a factor of 3 above the average for local IR
starbursts. Using a dense gas conversion factor for the HCN luminosity
HCN
7 M
(K km s-1 pc2)-1
(Gao & Solomon 2004)
leads to a dense gas mass of 1, 4, and 5 × 10¹⁰
M for F10214,
the Cloverleaf, and VCV J1409, respectively, where
the mass of dense gas in VCV J1409 assumes no magnification by a
gravitational lens. Assuming that all of the FIR
luminosity is from star formation leads to lifetimes for the dense gas
of approximately 10-20 million years.
There are four other EMGs with upper limits for HCN (Carilli et al. 2004; Izaak et al. 2002); all seven high-z sources including the upper limits are within the range expected from an extension of the low-z galaxy FIR-HCN linear correlation if star formation is responsible for most of the FIR luminosity (Carilli et al. 2004).
3.3.2. ATOMIC CARBON
Observations of the forbidden fine-structure lines of neutral atomic
carbon in the Milky Way and nearby galaxies
(Ojha et al. 2001,
Gerin & Phillips
2000,
and references therein) have revealed a close association with CO
emission. Because the critical density for excitation of both
the [C I] (3 P1
 3P0) transition at 492.160
GHz and the (3P2
3P1) transition at 809.342 GHz is roughly
that of CO(1-0), these observations
suggest that the CO and [C I] emission originates in the same volume.
This fact presents the opportunity to examine the emission region
independently of CO, in a pair of optically thin
lines that can be used to infer C I excitation, physical conditions,
and mass. In EMGs, the large redshift eliminates the burden of working
at the [C I] rest frequencies, which fall in
regions where the Earth's atmosphere makes observations difficult.
Papadopoulos, Thi &
Viti (2004)
have discussed the utility of the the [C I] lines for the study
of EMGs.
3P0) transition at 492.160
GHz and the (3P2
3P1) transition at 809.342 GHz is roughly
that of CO(1-0), these observations
suggest that the CO and [C I] emission originates in the same volume.
This fact presents the opportunity to examine the emission region
independently of CO, in a pair of optically thin
lines that can be used to infer C I excitation, physical conditions,
and mass. In EMGs, the large redshift eliminates the burden of working
at the [C I] rest frequencies, which fall in
regions where the Earth's atmosphere makes observations difficult.
Papadopoulos, Thi &
Viti (2004)
have discussed the utility of the the [C I] lines for the study
of EMGs.
[C I](3P2
3P0) emission has been observed in five
ULIRGs
(Gerin & Phillips
2000;
Papadopoulos & Greve
2004),
where inferred masses of molecular gas from the [C I] observations
assuming a relative abundance of C I to H2, X(C I)
= 3 × 10⁻⁵, the value inferred for M82
(Weißet al. 2003),
agree well with those from CO
assuming = 0.8,
the value usually adopted for ULIRGs. This further supports a common
emission region hypothesis.
If the C I levels are thermally populated, then the excitation temperature can be calculated from Tex = 38.8 K / ln(2.11 / R[C I]), where R[C I]is the ratio of (2-1) to (1-0) integrated line intensities (Stutski et al. 1997). C I masses can be calculated from
M(C I) = 0.911 × 10⁻⁴
Q(Tex)
e62.5/Tex
L'[C I](3P2
3P1)
[M],
M(C I) = 1.902 × 10⁻⁴
Q(Tex)e23.6/Tex
L'[C I](3P1
3P0)
[M],
where Q(Tex) = 1 + 3eT1/Tex + 5eT2/Tex is the partition function (Weiß et al. 2005).
Four EMGs have been observed in [C I] emission: the Cloverleaf, F10214,
SMM J14011, and PSS J2322
(Barvainis et al. 1997;
Pety et al. 2004;
Weiß et al. 2003,
2005).
Only the Cloverleaf has been observed in
both [C I] lines, with an inferred excitation temperature of 30 K,
somewhat colder than the fit to the SED dust component of 50 K
(Weiß et al. 2003).
Assuming the same Tex for the
Cloverleaf and F10214, and using CO data to infer the mass of
H2,
Weiß et al. (2005)
found carbon abundances for all three of
X[C I] / X[H2] ~ 5 × 10⁻⁵,
assuming = 0.8, the
ULIRG value, and ignoring differential magnification of [C I] and CO. The
carbon abundance in PSS J2322 is 3 × 10⁻⁵
(Pety et al. 2004),
close to the value for the other three detections. This is an indication
of substantial enrichment in heavy elements as early as z ~ 2.5.
Within the uncertainties, there are no strong differences in the
properties inferred from [C I] observations between the
three QSOs and the SMG in the sample of four.
Theoretical models predict that [C II] emission in the
(2P3/2
2P1/2) fine-structure
line at 1900.54 GHz is an important coolant for the photo-dissociation
regions of molecular
clouds, more important than the emission lines of either CO, [C I], or
other atomic fine-structure lines. [C II] emission has been observed in
galactic molecular clouds, normal galaxies, and ULIRGs. The bulk of the
extragalactic observations were made with the Infrared
Space Observatory (ISO) and show that ULIRGs are weaker in [C II] than
might be expected from a simple extrapolation from the Milky Way (for a
review see
Malhotra 2000).
Only upper limits have been obtained for [C II] emission in EMGs (DJ
Benford et al. manuscript submitted,
van der Werf 1999).
A search for [C II] emission in SDSS J1148
(Bolatto, Francesco &
Willott 2004)
yielded an upper limit that suggests that the weakness of
[C II] emission in ULIRGs persists to redshifts as high as z ~ 6.
However, even at the current upper limits [C II] remains the dominant
coolant, roughly twice as important as CO and [C I] combined
(Pety et al. 2004).
This is an area where the sensitivity of ALMA is required for
significant progress.
3.4. Masses, Sizes, & Evolutionary Destiny
Size measurements of CO emission from EMGs are constrained by the limited resolution and sensitivity of existing telescope arrays. In strongly lensed systems this limitation can be overcome, and effective angular resolution of the source can be ten or more times greater than the instrumental resolution of the magnified image. Derived source diameters then depend on the accuracy of available lensing models. For most EMGs, the measured CO sizes provide only upper limits. There are a few EMGs, including two radio galaxies without lensing and two SMGs, where CO measurements indicate extended or complex CO morphology. There is also indirect evidence of extended, large molecular gas disks from measurement of extended nonthermal radio continuum (Chapman et al. 2004) and, by implication, extended FIR and CO emission based on the radio-FIR correlation (Carilli, Menten & Yun 1999). We concentrate here on direct CO measurements of the size and/or separation between the components of the molecular gas. The CO kinematics also makes it possible to estimate a dynamical mass that is independent of the gas mass determined from the CO line luminosity.
The size and mass of the molecular gas disks are important factors in
determining the evolutionary state of EMGs. Local infrared galaxies and, in
particular, ULIRGs share many of the properties of this high-redshift
sample. They have luminosities greater than 1012
L
(Sanders & Mirabel
1996)
and in a large sample all but one are CO luminous
(Solomon et al. 1997)
with an average gas mass of 7 × 10⁹
M (using the
conversion factor adopted in
Section 2.2). The molecular gas is in
centrally concentrated rotating
disks with characteristic diameters of 0.7-2.5 kpc
(Downes & Solomon
1998)
although molecular emission extends out about twice this far. ULIRGs
result from the merger of two gas-rich spiral galaxies
(Sanders & Mirabel
1996)
in which the gas is driven toward the center. The large gas mass and
presence of ample dense molecular gas
(Gao & Solomon 2004)
lead to models where most of the FIR luminosity is
derived from a starburst but
some of the ULIRGs are clearly composite AGN-starburst sources. Although
the properties of ULIRGS and EMGs overlap, many of the EMGs are more
extreme objects than ULIRGs with higher IR and CO luminosities implying
higher star formation rates and higher molecular gas mass.
This leads to suggestions that the submillimeter population, or some
portion of it, represents the formation of giant
(> L*) elliptical galaxies
(Genzel et al. 2003,
Greve et al. 2004a,
Neri et al. 2003,
Papadopoulos et
al. 2000),
clearly not what is happening in ULIRGs.
3.4.1. SUMMARY OF MOLECULAR GAS MASS (H2 +
He)
Figure 10 shows the gas mass
(H2+ He) derived from the CO luminosity for the ULIRGs and EMGs
as a function of redshift. In cases where the magnfication has been
estimated the figure shows the intrinsic
mass. Otherwise a magnification of 1 is assumed. There are 11 EMGs with
a gas mass essentially the same as that of local ULIRGs. As discussed in
the previous section, most of these (8/11) have the same or slightly higher
FIR luminosities as that of ULIRGs. One galaxy has a
gas mass 10 times less than a typical ULIRG, similar to an ordinary
spiral. This object, MS1512-cB58, is a
Lyman Break galaxy with a very large magnification
and is clearly not a part of the EMG population since it is not a
molecular gas-rich galaxy. There are 21 EMGs with a
molecular gas mass significantly higher than that found in ULIRGs and
higher than that of any galaxy in the local Universe. They range in gas
mass from about 2.5 to 10 × 1010
M.
They include SMGs, radio galaxies, and molecular disks
associated with a few quasars. Some of these systems have multiple
components and may represent interacting or merging galaxies. A few may
have lensing not yet detected or
with a magnification not properly estimated.
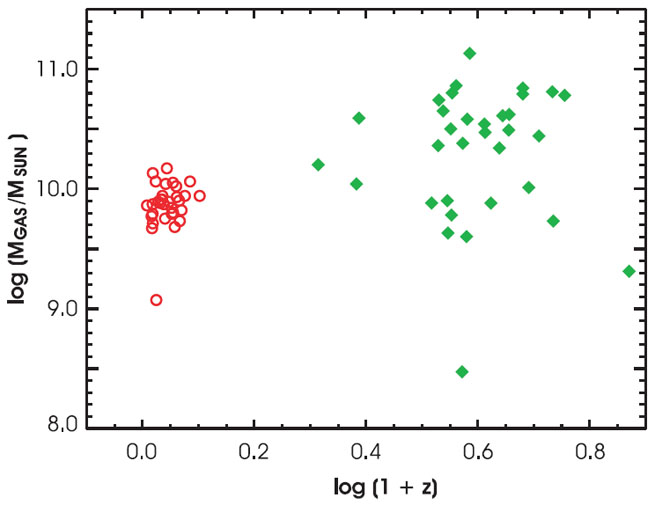 |
Figure 10. Molecular gas mass in ULIRGs and EMGs: logMgas versus log(1 + z) for ULIRGs (red circles) and EMGs (green diamonds). Mgas includes H2 and He. The EMGs are more massive on average than the ULIRGs, although there is considerable scatter among individual EMGs and substantial overlap with ULIRGs (see the text). |
3.4.2. SIZE MEASUREMENTS AND DYNAMICAL MASS
Table 2 summarizes the observed sizes of the CO
emission regions
excluding galaxies with upper limits. The full range of source diameters
is from 0.8 to 16 kpc with all but two of the
diameters falling between 1 and 5 kpc. The highly magnified CO emission
associated with some quasars in Table 2 has sizes
for the molecular rings or disks comparable to nearby ULIRGs. The
dynamical masses listed in Table 2 have been
calculated from
Mdyn sin2i = 233.5R
 V2,
where R is either the radius of the molecular disk or half the
separation between components in a merger model, measured in pc, and
V is the FWHM
of the CO line profile or half the
separation in velocity of the component CO lines in
a merger model, measured in kilometers per second. The unknown geometry
of these systems precludes more accurate estimates. Footnotes are given
for those cases where this calculation yields a
result differing substantially from that in the reference cited. The
gas masses for this subset
with measured sizes are the same as in
Table 1 and
Figure 10.
V2,
where R is either the radius of the molecular disk or half the
separation between components in a merger model, measured in pc, and
V is the FWHM
of the CO line profile or half the
separation in velocity of the component CO lines in
a merger model, measured in kilometers per second. The unknown geometry
of these systems precludes more accurate estimates. Footnotes are given
for those cases where this calculation yields a
result differing substantially from that in the reference cited. The
gas masses for this subset
with measured sizes are the same as in
Table 1 and
Figure 10.
| EMG | Mgas a | Mdyn sin2i b | Source size | Lens | |
| (=R(V)2
G-1) |
Inferred | Observed | mag. | ||
| disk diam. | comp. sep. | ||||
| (1010
M) |
(1010
M) |
(kpc) | (kpc) | ||
| SMM J02396 | 1.7 | 3.6 | - | 9.1 | 2.5 c |
| F10214 | 0.5 | 0.5 | 0.8 | - | 17 d |
| SMM J16359 | 0.5 | 0.7 | 3.0 | - | 45 e |
| Cloverleaf | 1.9 | 2.5 | 1.5 | - | 11 f |
| SMM J14011 | 0.3-1.5 | 0.3-1.5 | 0.7-7.0 | - | 2.5-25 g |
| SMM J02399 | 4.0 | 32 | 16 | - | 2.5 h |
| 4C60.07 | 4+7=11 | 10-43 | - | 7-30 i | 1 |
| 4C41.17 | 3+3=6 | 6 j | - | 13 | 1 |
| APM 08279 | 1.5 | 6.4 k | 2.0 | - | 7 j |
| PSS J2322 | 3.9 | 3.0 | 4.0 | - | 2.5 k |
| BRI 1335 | 2.6+3.8=6.4 | 18 | - | 8.7 | 1 |
| BR 1202S | 4.2+3.7=7.9 | 0.8 | - | 1.9 | 1 |
| SDSS J1148 l | 1.5 | 4.4 | 4.6 | - | 1 |
| SDSS J1148 m | 0.5+0.5=1.0 | 1.5 | - | 1.7 | 1 |
| ULIRGs (FWHM) n | 0.7-2.0 | 0.8-2.4 | - | 1 | |
| ULIRGs (total) p | 0.5-1.5 | 2-7 | 2.4-6.8 | - | 1 |
| a From
Table 1,
where Mgas = M(H2)
corrected to include He; bR = disk radius;
V= FWHM |
|||||
| of line profile or half the velocity separation of components; c Kneib et al. (1993); | |||||
| d D Downes & PM Solomon, manuscript in preparation; e Kneib et al. (2004b); f Venturini & Solomon (2003); | |||||
| g Downes & Solomon (2003); h Genzel et al. (2004); i Range reflects change in component | |||||
| separation with image tapering; j Lewis et al. (2002), authors used HWHM velocity, | |||||
| yielding Mdyn =
1.5 × 10¹⁰
M
after adjusting for cosmology; k
Carilli et
al. (2003); |
|||||
| lLow resolution (1.5") image; mHigh resolution (0.15") image; n For radius at half maximum | |||||
| of gas density; p For radius of full extent of gas. | |||||
The largest source is the SMG J02399 with a diameter of 16 kpc
(Genzel et al. 2003)
after allowing for a magnification of 2.5 due to the
intervening cluster lens. The size is obtained from the CO data by
fitting a model of a rotating disk with a velocity of 420 km
s-1, a flat rotation curve and
a large turbulent velocity. This leads to a molecular ring with a
maximum gas density at R = 3.2 kpc and a width of 1-1.5 kpc. The
6-8 kpc outer radius for
the gas also matches the extent of the submillimeter dust continuum.
The ring is required to fit the double-peaked line profile. This large
disk size is the total extent rather than the half power diameter which
is only about 1 kpc larger than the peak of the ring corresponding to a
half power diameter of 8 kpc. Although
Genzel et al. (2003)
stress the rotating molecular starburst ring
model with an AGN at the center of the ring, an alternative
configuration with two galaxies orbiting each other with the AGN in
either the red or blueshifted CO source is possible. Indeed, the
double-horned line profile with a steep drop in the middle and the
position velocity diagram could easily be due to two separate galaxies,
each with a much smaller unresolved CO disk or ring. Thus, it is not
clear if the quoted diameter is a separation
between two unresolved disks or a disk size. The dynamical mass for a
merger model is Mdyn sin2i ~ 3
× 1011
M.
The other SMG with a measured CO size is J14011.
Ivison et al. (2001)
found a CO(3-2)
size of 6.6" corresponding to 56 kpc in the image plane and 22
kpc in the source after accounting for magnification by a factor of 2.5
due to the intervening
cluster Abell 1835. If real, this would have been the largest
high-redshift galaxy found at any wavelength.
Downes & Solomon
(2003)
using the IRAM interferometer mapped both the (3-2) and (7-6) lines
with high sensitivity and resolution. They measured the peak flux to
an accuracy of 14 and found
an image size of 2" ×
and found
an image size of 2" ×
 0.5". For
magnification as small as 2.5, the intrinsic
source diameter is reduced to less than 7 kpc.
Downes & Solomon
(2003)
also suggested a lensing model with an intervening galaxy in addition
to the cluster lens. The total magnification was 25fv where
fv is the velocity filling factor of the CO
emission. This model, with increased magnification by an intervening
galaxy, has been questioned
(Genzel et al. 2003,
Tecza et al. 2004),
but
Tecza et al. (2004)
increased the expected cluster magnification to 5.
In Table 2 we treat the magnification of J14011 as uncertain with a maximum of 25 and a
minimum of 5. This reduces the source diameter to the range of 0.7-3.5
kpc. The molecular mass is in the range of 0.4-1.7 × 10¹⁰
M. The
observed CO spectral line is narrow with a FWHM of 190 km s-1
(Downes & Solomon
2003)
indicating a moderate dynamical mass of about 3 × 10¹⁰
M for an assumed
inclination of 45∘ and the larger diameter of 3.5
kpc. Unless the disk is completely face on and/or the magnification is
much less than 5, the dynamical
mass is similar to that of ULIRGs such as Mrk 231, Arp 220, VII ZW31IR23365+36
(Downes & Solomon
1998).
0.5". For
magnification as small as 2.5, the intrinsic
source diameter is reduced to less than 7 kpc.
Downes & Solomon
(2003)
also suggested a lensing model with an intervening galaxy in addition
to the cluster lens. The total magnification was 25fv where
fv is the velocity filling factor of the CO
emission. This model, with increased magnification by an intervening
galaxy, has been questioned
(Genzel et al. 2003,
Tecza et al. 2004),
but
Tecza et al. (2004)
increased the expected cluster magnification to 5.
In Table 2 we treat the magnification of J14011 as uncertain with a maximum of 25 and a
minimum of 5. This reduces the source diameter to the range of 0.7-3.5
kpc. The molecular mass is in the range of 0.4-1.7 × 10¹⁰
M. The
observed CO spectral line is narrow with a FWHM of 190 km s-1
(Downes & Solomon
2003)
indicating a moderate dynamical mass of about 3 × 10¹⁰
M for an assumed
inclination of 45∘ and the larger diameter of 3.5
kpc. Unless the disk is completely face on and/or the magnification is
much less than 5, the dynamical
mass is similar to that of ULIRGs such as Mrk 231, Arp 220, VII ZW31IR23365+36
(Downes & Solomon
1998).
As part of a large survey of CO emission from SMGs
Greve et al. (2004a)
summarized the measured linewidth and CO luminosity of 11
SMGs. They found a large median linewidth of 780 ± 330 km
s-1 (FWHM), 2.5 times larger than the median width for local
Universe ULIRGs, with several
examples of double-peaked profiles. The largest linewidth for a ULIRG
in a sample of 37 galaxies is 480 km s-1. The SMG sample also
has a high median CO line luminosity
(3.6 × 10¹⁰ K km s-1 pc2)
with a median molecular mass of 3 × 10¹⁰
M, four times
higher than the ULIRG mean
(Solomon et al. 1997).
Although
Greve et al. (2004a)
concluded that this is sufficient gas mass to form the stars of a giant
elliptical galaxy, it seems small
unless most of the mass is already in stars and the SMGs represent a
late stage of galaxy formation. The large linewidths indicate a large
but very uncertain dynamical mass, owing to
the absence of size measurements and unknown geometry. Assuming a
separation (diameter) of 3.7 kpc
Greve et al. (2004a)
gave a median dynamical mass
Mdyn sin2i = 1.2 ×
1011 M.
There are some IR luminous interacting galaxies in the local Universe with very large linewidths similar to the EMGs; one example is the LIRG Arp 118 (NGC1144) - an unusual ring galaxy with a total CO linewidth of 1100 km s-1 and a FWHM of about 750 km s-1. Whereas the linewidths of the SMG population are similar, the SMG population is more than an order of magnitude higher in luminosity.
The most impressive measurement in Table 2 is the size and structure of the CO(3-2) emission from the z = 6.4 quasar J1148+52. Walter et al. (2004) mapped the CO(3-2) line with a resolution of 0.3" and 0.15", the latter equivalent to about 1 kpc. The results show a disk with a maximum diameter of 4.8 kpc and a FWHM of 3.5 kpc. The entire disk is two or three times as large as a typical ULIRG. The core region shows two distinct sources separated by 1.7 kpc with a size of roughly 0.5 kpc that account for half of the total emission. Each of these regions is similar to a nearby ULIRG in terms of mass, intrinsic brightness temperature, and size (Walter et al. 2004). A detailed comparison with ULIRGs suggests that each of these components may resemble the core of the molecular region in a ULIRG rather than the whole disk.
Some of the high-z radio galaxies show kinematic structure indicating
the presence of two merging galaxies. In 4C41.17
(De Breuck et al. 2004)
the two CO components are separated by 1.8" or 13 kpc with a
velocity difference of 500 km s-1. Each
component has a molecular mass of about 3 × 10¹⁰
M. This
system appears to be a major merger in progress between two gas-rich
galaxies rather than
one extended very massive disk. Each component remains unresolved. The
dynamical mass of the system is Mdyn
sin2i = 6 × 10¹¹
M.
4C60.07 also shows possible evidence of an ongoing
merger between two galaxies although the angular separation between the
components is not well determined.
Papadopoulos et
al. (2000)
imaged the CO(4-3) line and found an extent or separation of
7" or 51 kpc, but the resolution
of the measurements was only 9" × 5.5". Higher
resolution measurements in the CO(1-0) line
(Greve et al. 2004)
show a separation of 4" or about
28 kpc in the images tapered
to 60 k ; the higher
resolution images tapered to 200
k
show a smaller angular separation of only about 1". Using the
larger separation they calculate a total dynamical
mass between 0.2 and 0.8 × 10¹²
M comparable to
the mass of a giant elliptical galaxy.
; the higher
resolution images tapered to 200
k
show a smaller angular separation of only about 1". Using the
larger separation they calculate a total dynamical
mass between 0.2 and 0.8 × 10¹²
M comparable to
the mass of a giant elliptical galaxy.
In Table 2 we list two size ranges for ULIRG molecular disks in the local Universe, including the half-power diameter and the total diameter for CO emission. The measured diameters of EMGs fit within the range measured for ULIRGs with one noticeable exception. The total gas mass of EMGs covers a wide range. About half of the EMGs have a total gas mass above that found for any ULIRG and, thus, represent the largest reservoirs of star-forming molecular gas in the Universe.
3.4.3. ARE EMGS MASSIVE GALAXIES IN FORMATION?
A critical question is whether the EMGs or some fraction of the EMGs
represent the formation of massive galaxies in the early Universe. The
star formation rates derived from the FIR
luminosity range from about 300 to 5000
M
year-1 (see Figure 8). At the lower end, these
star formation rates are similar to local ULIRGs and represent
starbursts in centrally concentrated
disks sometimes but not always associated with AGNs. These events may
form a central bulge but not a giant elliptical galaxy. At the higher
end, it would take 108 years to produce a
stellar mass of 3-5 × 10¹¹
M typical of
the stellar mass of a giant elliptical galaxy.
This is a reasonable time scale. However, the available molecular gas
supply, about 3-6 × 10¹⁰
M, falls short
by a factor of 5-10. The gas lifetime is too short. The remaining 80-90%
of the mass would already have to be in the stellar component of
the EMGs or added later by subsequent mergers in order to account for
the formation of a giant elliptical galaxy. Accurate
measurements of the dynamical mass and size scale of EMGs are needed to
provide convincing evidence for EMG masses similar to modern elliptical
galaxies. Table 2 shows five EMGs with the
approximate dynamical mass in the right range, but the size
measurements are only marginally
significant in most cases. The large linewidths of the SMG population
(Greve et al. 2004a)
are a good indication that the total mass of some of
these early galaxies is large but most of these have unknown morphology
and do not have size measurements. CO images with substantially higher
resolution and sensitivity are required.
The EMG population clearly represents a major stage in galaxy formation. The high star formation rates, high total molecular mass, and, in some cases, high mass of dense molecular gas all point to huge starbursts, much greater than observed in individual optical-UV starbursts.
3.4.4. COMPARISON WITH LYMAN BREAK GALAXIES
The distribution of star formation rates from LBGs obtained directly from
the UV flux shows a peak at about 20
M
year-1 falling off rapidly for higher star formation rates
(Giavalisco, 2002).
Correction for extinction involving dust scattering models and
stellar population synthesis shifts the peak to about 100
M
year-1 with a broad distribution and a tail extending up to
about 700 M
year-1. In the most extreme cases the UV radiation captures
much less than 10% of the total
luminosity with the rest shifted into the infrared. Tests of this
extinction correction technique show that it fails completely for local
ULIRGs (for example,
Giavalisco 2002)
and would also fail for
EMGs. The range of star formation rates for EMGs begins at the higher
end of the extinction-corrected UV values for LBGs and extends upward by an
order of magnitude.
Giavalisco (2002)
suggests that the star formation observed
in LBGs could lead after 1 Gyr to an L* galaxy. But there is no
evidence for the presence of sufficient interstellar gas in LBGs to
build up an L* galaxy. The one LBG found with CO emission, MS1512-cB58 (see Table 2),
contains only a few × 108
M of molecular
gas, 30 times less than the mean of the EMG sample (this EMG
appears as a low outlier in Figure 6), and more than two orders of
magnitude below the mass of an L* galaxy.
The total contribution to early Universe star formation from SMGs compared with LBGs depends on an understanding of the origin of the FIR background, a topic addressed elsewhere (Puget & Lagache, this volume).