


Extragalactic radio sources are well suited to probe the large-scale
structure of the Universe: detectable over large cosmological distances,
they are unaffected by dust extinction, and can thus provide an unbiased
sampling of volumes larger than those usually probed by optical
surveys. On the other hand, their 3D space-distribution can be recovered
only in the very local Universe
(z  0.1; see
Peacock
& Nicholson 1991,
Magliocchetti et al. 2004)
because the majority of radio galaxies detected in the
available large-area, yet relatively deep, surveys, carried out at
frequencies
0.1; see
Peacock
& Nicholson 1991,
Magliocchetti et al. 2004)
because the majority of radio galaxies detected in the
available large-area, yet relatively deep, surveys, carried out at
frequencies  1.4 GHz,
have very faint optical counterparts, so that redshift measurements are
difficult. As a result, only the angular (2D) clustering can be
measured for the entire radio AGN population. High-frequency surveys
have much higher identification rates
(Sadler
et al. 2006),
suggesting that this difficulty may be overcome when such surveys cover
sufficient sky and are linked to wide-area redshift surveys.
1.4 GHz,
have very faint optical counterparts, so that redshift measurements are
difficult. As a result, only the angular (2D) clustering can be
measured for the entire radio AGN population. High-frequency surveys
have much higher identification rates
(Sadler
et al. 2006),
suggesting that this difficulty may be overcome when such surveys cover
sufficient sky and are linked to wide-area redshift surveys.
9.1. The angular correlation function and its implications
Just the basic detection of clustering in the 2D distribution of radio
sources proved to be extremely difficult (e.g.
Webster
1976,
Seldner
& Peebles 1981,
Shaver
& Pierre 1989)
because at any flux-density limit, the broad
luminosity function translates into a broad redshift distribution,
strongly diluting the spatial correlations when projected onto the
sky. Only with the advent of deep radio surveys covering large areas of
the sky, FIRST
(Becker
et al. 1995),
WENSS
(Rengelink et al. 1997),
NVSS
(Condon
et al. 1998),
and SUMSS
(Mauch
et al. 2003),
did it become possible to detect the angular
clustering of these objects with high statistical significance: see
Cress
& Kamionkowski (1998)
and
Magliocchetti et al. (1998),
Magliocchetti et al. (1999),
Blake
& Wall (2002a)
for FIRST;
Blake
& Wall (2002b),
Blake
& Wall (2002a)
and
Overzier et al. (2003)
for NVSS;
Rengelink (1999)
for WENSS; and
Blake
et al. (2004b).
Even then there remained difficulties of
interpretation due to spurious correlation at small angular scales
caused by the multiple-component nature of extended radio sources
(Blake
& Wall 2002b);
the raw catalogues constructed from these large
surveys list components of sources rather than single `assembled'
sources. Amongst the cited surveys, NVSS is characterized by the most
extensive sky coverage and can thus provide the best clustering
statistics, despite its somewhat higher completeness limit (~
3 mJy vs ~ 1 mJy of FIRST). The two-point angular correlation function
w( ), measured for
NVSS sources
brighter than 10 mJy, is well described by a power-law of slope -0.8
extending from ~ 0.1 degrees up to scales of almost 10 degrees
(Blake
& Wall 2002a).
A signal of comparable amplitude and shape was detected in the FIRST
survey at the same flux density limit, on scales of up to 2-3 degrees
(see e.g.
Magliocchetti et al. 1998,
Magliocchetti et al. 1999),
while at larger angular separations any positive
clustering signal - if present - is hidden by the Poisson noise.
), measured for
NVSS sources
brighter than 10 mJy, is well described by a power-law of slope -0.8
extending from ~ 0.1 degrees up to scales of almost 10 degrees
(Blake
& Wall 2002a).
A signal of comparable amplitude and shape was detected in the FIRST
survey at the same flux density limit, on scales of up to 2-3 degrees
(see e.g.
Magliocchetti et al. 1998,
Magliocchetti et al. 1999),
while at larger angular separations any positive
clustering signal - if present - is hidden by the Poisson noise.
Most of the analyses performed so far with the aim of reproducing the
clustering of radio galaxies (see e.g.
Blake &
Wall 2002b,
Blake &
Wall 2002a,
Overzier
et al. 2003)
assumed a two-point spatial correlation function of the form
 rg(r) = (r /
r0)-
rg(r) = (r /
r0)- . The
power-law shape is in fact preserved when projected onto the sky
(Limber
1953),
so that the observed behaviour of the angular correlation is well
recovered. The correlation length r0 was found to lie
in the range 5-15 Mpc, the large range reflecting the uncertainties in
both the redshift distribution of the sources and the time-evolution of
clustering. Despite the wide range in measurement of
r0, the above results suggest that radio galaxies are
more strongly clustered than optically-selected galaxies.
. The
power-law shape is in fact preserved when projected onto the sky
(Limber
1953),
so that the observed behaviour of the angular correlation is well
recovered. The correlation length r0 was found to lie
in the range 5-15 Mpc, the large range reflecting the uncertainties in
both the redshift distribution of the sources and the time-evolution of
clustering. Despite the wide range in measurement of
r0, the above results suggest that radio galaxies are
more strongly clustered than optically-selected galaxies.
A deeper examination of the power-law behaviour of the angular two-point
correlation function up to scales of the order of ~ 10°
highlights interesting issues. Within the Cold Dark Matter paradigm of
structure formation, the spatial correlation function of matter displays
a sharp cut-off near a comoving radius of r ~ 100 Mpc,
which at the average redshift for radio sources <z> ~ 1,
corresponds to angular separations of only a few (~ 1°-2°)
degrees. This is in clear contrast to the observations of the angular
two-point correlation function. The question is how to reconcile the
clustering properties of these sources with the standard scenario of
structure formation. Some authors have tried to explain the large-scale
positive tail of the angular correlation function
w() as
due to a high-density local population of star-forming galaxies
Blake
et al. (2004a).
Others
Magliocchetti et al. (1999)
suggested that the results can be reproduced by a
suitable choice of the time-evolution of the bias parameter, i.e. the
way radio galaxies trace the underlying mass distribution. The first
hypothesis can be discarded on the basis of more recent determinations
of the space density of local star-forming galaxies with a 1.4-GHz radio
counterpart (e.g.
Magliocchetti et al. 2002,
Sadler
et al. 2002,
Mauch
& Sadler 2007).
Even the second approach, although promising, suffers a number of
limitations due to both theoretical modelling and quality of data then
available.
Theoretical predictions for the angular two-point correlation function of a given class of objects using Limber (1953) equation
 |
(22) |
require two basic ingredients: their redshift distribution,
 (z), i.e. the number
of objects brighter
than the flux limit of the survey as a function of redshift, and the
value of the bias factor as a function of redshift,
b(z). In equation (22),
r(
(z), i.e. the number
of objects brighter
than the flux limit of the survey as a function of redshift, and the
value of the bias factor as a function of redshift,
b(z). In equation (22),
r( z,
) represents the
comoving
spatial distance between two objects located at redshifts z and
z + z and
separated by an angle
on the sky. For a flat universe and in the small-angle approximation
(still reasonably accurate for scales of interest here,
0.3°
10°)
z,
) represents the
comoving
spatial distance between two objects located at redshifts z and
z + z and
separated by an angle
on the sky. For a flat universe and in the small-angle approximation
(still reasonably accurate for scales of interest here,
0.3°
10°)
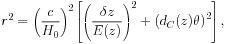 |
(23) |
with
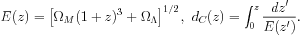 |
(24) |
On sufficiently large scales, where the clustering signal is produced by
galaxies residing in distinct dark-matter halos and under the assumption
of a one-to-one correspondence between sources and their host halos, the
spatial two-point correlation function can be written as the product of
the correlation function of dark matter,
DM, times
the square of the bias parameter, b
(Matarrese et al. 1997,
Moscardini et al. 1998):
 |
(25) |
Here, Meff is the effective mass of the dark matter haloes in which the sources reside and b is derived in the extended Press & Schechter (1974) formalism according to the prescriptions of Sheth & Tormen (1999).
Negrello et al. (2006)
adopted the (z)
from
Dunlop
& Peacock (1990)'s
pure luminosity evolution model. If the effective
mass of the dark matter haloes in which the sources reside does not
depend on cosmic time, as found for optically-selected quasars
(Porciani et al. 2004,
Croom et
al. 2004),
the predicted angular correlation function badly fails
to reproduce the observed one. This is because contributions to
w() on a given
angular scale come from both local,
relatively close pairs of sources and from high-redshift, more distant
ones. But for z
 1
angular scales
2°
correspond to linear scales where the correlation function is
negative. Since the contribution of distant objects is overwhelming, we
expect negative values of
w(), while
observations give us positive values.
1
angular scales
2°
correspond to linear scales where the correlation function is
negative. Since the contribution of distant objects is overwhelming, we
expect negative values of
w(), while
observations give us positive values.
The only way out appears to be a damping down of the contribution to
w() of
high-z sources, and this can only be
achieved through b(z).
Negrello
et al. (2006)
found that the w()
data can be reproduced
by assuming an epoch-dependent effective mass proportional to the mass
scale at which the matter-density fluctuations collapse to form bound
structures. Such mass decreases with increasing redshift, thus abating
the negative high-z contributions to
w(). This
assumption may be justified - locally, AGN-powered radio galaxies are
found mainly in very dense environments such as groups or clusters of
galaxies, and the characteristic mass of virialized systems indeed
decreases with increasing redshift. The best fit to the data was
obtained for a high value of the local effective mass,
Meff(z = 0)
 1015
M
1015
M /
h. However the CENSORS data
(Brookes
et al. 2008)
have shown that the redshift distribution peaks at
lower redshifts than predicted by
Dunlop
& Peacock (1990)
PLE model (Fig. 11). Using a smooth
description of the CENSORS redshift distribution
/
h. However the CENSORS data
(Brookes
et al. 2008)
have shown that the redshift distribution peaks at
lower redshifts than predicted by
Dunlop
& Peacock (1990)
PLE model (Fig. 11). Using a smooth
description of the CENSORS redshift distribution
 |
(26) |
the best fit is obtained with a
somewhat lower value for the local effective mass,
Meff(z = 0)
1014.5
M / h
(Fig. 13).
 |
Figure 13. Two-point angular correlation
function of NVSS sources with
S1.4GHz |
9.2. Integrated Sachs-Wolfe (ISW) effect
The ISW effect describes the influence of the evolution of the gravitational potential in time-variable, linear, metric perturbations on CMB photons that traverse them. When the CMB photons enter an overdensity they are gravitationally blue-shifted, and they are red-shifted when they emerge. In an Einstein-de Sitter universe the density contrast grows as the linear scale, so that the gravitational potential associated with the mass fluctuation is independent of time. Hence the red- and the blue-shift exactly compensate each other and the net effect is zero. However, a non-zero effect arises if the gravitational potential decays, as in the case of an open universe when the effect of the space curvature is important, or when the dynamics of the universe are dominated by dark energy.
As first pointed out by Crittenden & Turok (1996), a promising way of probing the ISW effect is through correlating fluctuations in the Cosmic Microwave Background (CMB) with large-scale structure. Since the timescale for the decay of the potential is of the order of the present-day Hubble time, the effect is largely canceled on small scales, because photons travel through multiple density peaks and troughs. This is why surveys covering large areas of the sky and probing the large scale distribution up to z ~ 1 are necessary.
A high quality all-sky CMB temperature map has been provided by the WMAP satellite (Bennett et al. 2003, Hinshaw et al. 2007, Hinshaw & Naeye 2008). A particularly well-suited probe of the large-scale structure is the NVSS survey, and indeed this has been extensively exploited to look for the ISW signal (Boughn & Crittenden 2004, Boughn & Crittenden 2005, Pietrobon et al. 2006, McEwen et al. 2007, McEwen et al. 2008, Ho et al. 2008, Giannantonio et al. 2008, Raccanelli et al. 2008).
The comparison of the correlations inferred from the data with model
predictions requires once again the redshift distribution and the bias
parameter as a function of redshift. All analyses carried out so far
have used redshift distributions inconsistent with the CENSORS
results. The product of the latter redshift distribution with the
redshift-dependent bias factor best fitting the observed
w() (see the
previous sub-section), whose integral determines the amplitude of the
ISW effect, peaks at redshifts where the contribution to the ISW signal in a
 CDM cosmology also
peaks, namely z
0.4. This means that the NVSS sample is very well
suited to test the effects of dark energy on the growth of
structure. The predicted cross-correlation power spectrum between the
surface density fluctuations of NVSS sources and the CMB fluctuations
expected for the "concordance"
CDM cosmology turns
out to be in good agreement with the empirical determination using the
CMB map obtained from WMAP data. This conclusion is at odds with that of
Ho et
al. (2008)
who found that the WMAP 3-year model predicts an ISW
amplitude about 2
CDM cosmology also
peaks, namely z
0.4. This means that the NVSS sample is very well
suited to test the effects of dark energy on the growth of
structure. The predicted cross-correlation power spectrum between the
surface density fluctuations of NVSS sources and the CMB fluctuations
expected for the "concordance"
CDM cosmology turns
out to be in good agreement with the empirical determination using the
CMB map obtained from WMAP data. This conclusion is at odds with that of
Ho et
al. (2008)
who found that the WMAP 3-year model predicts an ISW
amplitude about 2 below
their estimate. Hence we suggest that the
amplitude of the ISW cross-correlation does not support the case for new
gravitational physics on cosmological scales
(Afshordi et al. 2008)
or for a large local primordial non-Gaussianity
(Afshordi & Tolley 2008).
below
their estimate. Hence we suggest that the
amplitude of the ISW cross-correlation does not support the case for new
gravitational physics on cosmological scales
(Afshordi et al. 2008)
or for a large local primordial non-Gaussianity
(Afshordi & Tolley 2008).

 10 mJy as measured by
 = 0.0001 to
w(
= 0.0001 to
w(