


Galaxies emit across the electromagnetic spectrum. Excluding those
galaxies dominated by an accreting supermassive black hole at their
nucleus (AGN), the ultraviolet to infrared spectra of all galaxies
arises from stellar light, either directly or reprocessed by the gas and
dust of the surrounding interstellar medium (ISM). Thus the UV-to-IR
spectral energy distribution or SED contains a large amount of
information about the stars of a galaxy, such as the stellar mass to
light ratio, and the surrounding ISM, such as the total dust
mass. However, to extract such information, models are necessary in
order to connect physical properties of the galaxy with the observed
SED. In this section we discuss such models, beginning with the stellar
spectrophotometric models, moving on to the transfer of the radiation of
these stars in a galaxy through the ISM, and finally how to connect
these with the larger picture of galaxy formation and evolution. We use
the following abbreviations for designing wavelength ranges, though the
exact boundaries between wavelength regimes are not sharp: ultraviolet
(UV) for  < 3500
Å, optical for 3500 <
< 8000 Å,
near infrared (NIR) 0.8 <
< 3
µm, mid-infrared (MIR) 3 <
< 25
µm, far-infrared (FIR) 25 <
< 250
µm, sub-mm 0.25 <
< 1 mm, and radio
> 1 mm.
< 3500
Å, optical for 3500 <
< 8000 Å,
near infrared (NIR) 0.8 <
< 3
µm, mid-infrared (MIR) 3 <
< 25
µm, far-infrared (FIR) 25 <
< 250
µm, sub-mm 0.25 <
< 1 mm, and radio
> 1 mm.
In its simplest sense, a galaxy is a population of stars ranging from numerous, low-luminosity, low-mass stars, to the bright, short-lived, massive OB stars. On closer examination, these stars are distributed in both metallicity content and age ranging from when the galaxy first formed to those newly born. The method of creating a galactic spectrum through the sum of the spectra of its stars is called stellar population synthesis and was pioneered in works by Tinsley (1972), Searle et al. (1973) and Larson and Tinsley (1978). A simplification for the modelling of galactic SEDs is that the emitted light can be represented through a sum of spectra of simple stellar populations (SSPs) with different age and element abundances. Here a SSP is an idealized single-age, single-abundance ensemble of stars whose distribution in mass depends on both the initial distribution and the assumed age of the ensemble.
There are two main methods used by current stellar spectrophotometric models to compute the SEDs of SSPs: The first is called 'isochrone synthesis'. It uses the locus of stars with the same age, called an isochrone, in the Hertzsprung-Russel diagram and then integrates the spectra of all stars along the isochrone to compute the total flux. This method was established by Chiosi et al. (1988), Maeder and Meynet (1988) and in particular Charlot and Bruzual (1991) and is currently used by the majority of stellar population models. The second uses the `fuel consumption' approach. One of the problems of the isochrone synthesis method was that isochrones are calculated in discrete steps in time and therefore phases where stellar evolution is more rapid than theses timesteps were not well represented (the most famous example of the last years being the thermally pulsing asymptotic giant branch stars). Models using the fuel consumption theorem circumvent this problem by changing the integration variable above the main sequence turnoff to the stellar fuel, i.e. the amount of hydrogen and helium used in nuclear burning. The fuel is integrated along the evolutionary track. The main idea is that the luminosity of the post-main sequence stars, which are the most luminous, is directly linked to the fuel available to stars at the turnoff mass (for full details, see e.g. Buzzoni 1989, Maraston 1998, Maraston 2005). While these methods are fundamentally different in their integration methods, most of the issues discussed here in terms of stellar evolution and stellar libraries apply to both.
2.1.1. Simple stellar populations
The spectrum (flux emitted per unit frequency per unit mass),
L ,
of a SSP of mass M, age t, and metallicity Z is given by the
sum of the individual stars:
,
of a SSP of mass M, age t, and metallicity Z is given by the
sum of the individual stars:
 |
(1) |
In practice the emitted light is dominated by the most massive, luminous stars.
The stellar mass function,  (M)t,Z, is
computed from an initial mass function (IMF,
0(M)) and stellar evolution,
which describes when and which stars will stop contributing to the
SSP spectra because they end their lives either as Supernovae or as
white dwarfs. The IMF describes the distribution in mass of a putative
zero-age main sequence
stellar population and is an input parameter of stellar population
synthesis models. The IMF is usually limited between a minimum
and maximum stellar mass (generally Mmin ~ 0.05-1.0
M
(M)t,Z, is
computed from an initial mass function (IMF,
0(M)) and stellar evolution,
which describes when and which stars will stop contributing to the
SSP spectra because they end their lives either as Supernovae or as
white dwarfs. The IMF describes the distribution in mass of a putative
zero-age main sequence
stellar population and is an input parameter of stellar population
synthesis models. The IMF is usually limited between a minimum
and maximum stellar mass (generally Mmin ~ 0.05-1.0
M ;
Mmax ~ 100-150
M).
Three empirical forms are most commonly used: a simple power-law model
(Salpeter 1955,
Massey 1998),
a broken power-law
(Kroupa 2001),
or a lognormal form
(Chabrier 2001).
However whether these forms hold in all conditions
and for all redshifts is still an open question (A good coverage
of this field can be found in the "IMF@50" proceedings,
E. Corbelli,
F. Palla, & H. Zinnecker 2005).
;
Mmax ~ 100-150
M).
Three empirical forms are most commonly used: a simple power-law model
(Salpeter 1955,
Massey 1998),
a broken power-law
(Kroupa 2001),
or a lognormal form
(Chabrier 2001).
However whether these forms hold in all conditions
and for all redshifts is still an open question (A good coverage
of this field can be found in the "IMF@50" proceedings,
E. Corbelli,
F. Palla, & H. Zinnecker 2005).
The true difficulty of calculating equation 1 lies in the second
part, determining the SED
(L)
of a star of initial mass, M, age,
t, and metallicity, Z. This requires;
1) the computation of stellar evolutionary tracks that determine where a
star of
given stellar parameters (e.g. mass M, age t and abundance Z)
lies on the Hertzsprung-Russel diagram or log g - Teff
diagram, to build up the stellar 'isochrone', and 2) the computation
or empirical building of a stellar library of
L
with full coverage of logg,Teff, and Z
to determine what the resulting spectrum of such a star is.
The creation of stellar isochrones requires a large grid of
evolutionary tracks, created by modelling the evolution of stars of a
given initial mass and metal content. Over the past few decades,
much work has gone into providing homogeneous sets of stellar tracks
from different groups, e.g. Padova
(Marigo and Girardi
2007,
Marigo et
al. 2008),
Geneva
(Lejeune and
Schaerer 2001),
Yale
(Demarque et
al. 2004),
MPA
(Weiss and Schlattl
2008),
BaSTI
(Pietrinferni
et al. 2009).
For SSP modelling, the models generally run from the start of the
main sequence (Zero Age Main Sequence, ZAMS) to some end point of the
star, such as a supernova or the asymptotic giant branch (AGB) phase.
Originally computed only for a solar metallicity composition and a few
stellar masses, sets of homogeneous stellar evolutionary tracks now
exist for a wide range of initial masses (from ~ 0.1
M to ~ 120
M; see e.g.
Girardi et
al. 2000,
Meynet and Maeder
2005)
and metallicities ( ~ 0.01 to ~ 4
Z).
In most stellar evolutionary modelling it has been assumed that for
all stellar masses the elemental composition is the same for a given
metallicity, however more recently the evolutionary effects of
elemental variations such as
 -enhancement (e.g.
Salasnich et
al. 2000)
or individual element variations (e.g.
Dotter et al. 2007)
have been investigated.
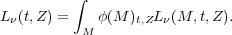
However problems still remain in the field, with the different treatments
by the different groups still giving distinct evolutionary tracks
even with the same inputs, as shown in figure 1.
-enhancement (e.g.
Salasnich et
al. 2000)
or individual element variations (e.g.
Dotter et al. 2007)
have been investigated.
However problems still remain in the field, with the different treatments
by the different groups still giving distinct evolutionary tracks
even with the same inputs, as shown in figure 1.
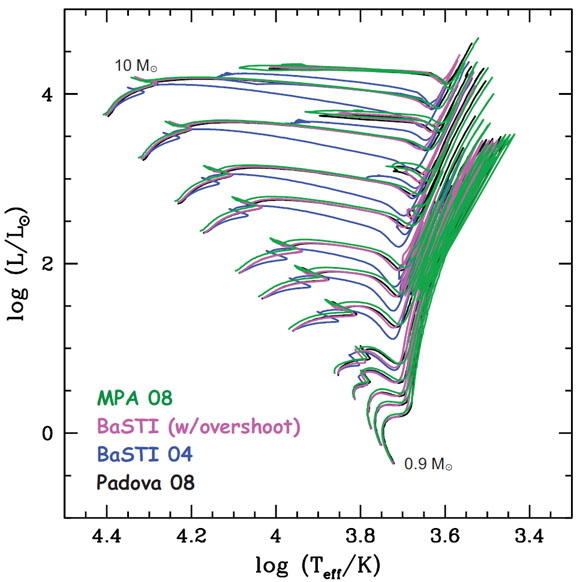 |
Figure 1.Evolutionary tracks of solar
composition low mass stars (0.9 - 10
M |
While the evolutionary tracks lead to the generation of an isochrone,
to determine a SSP spectrum, a library of stellar spectra is needed,
covering the necessary parameter space in log Teff, log
g, metallicity etc. As with the evolutionary tracks, stellar
libraries have improved significantly in recent years, with both fully
theoretical (e.g.
Kurucz 1992,
Westera et
al. 2002,
Smith et al. 2002,
Coelho et al. 2005,
Martins et
al. 2005,
Lançon et
al. 2007)
and empirical, e.g. STELIB
(Le Borgne et
al. 2003),
MILES
(Sánchez-Blázquez et al. 2006,
Cenarro et
al. 2007),
Indo-US
(Valdes et
al. 2004),
ELODIE
(Prugniel and
Soubiran 2001,
Prugniel et
al. 2007),
HST/NGSL
(Gregg et al. 2004)
libraries covering much greater parameter spaces and increasing in both
spectral and parameter resolution (see figure 2).
Unlike the optical, the UV still suffers from incomplete libraries which
is specially important for fully exploiting data on high redshift
galaxies (see e.g.
Pellerin and
Finkelstein 2009).
The question about which
of empirical or theoretical libraries is preferable is a matter of the
specific application (for a short review on both sets of libraries and
their respective issues, see
Coelho 2009).
The main benefit of the empirical libraries is that
they are based on real stars and thus avoid uncertainties in stellar
atmosphere structure or in opacities. On the other hand, due to the
observational limits they cover a restricted parameter space biased
towards Milky way compositions (see e.g.
Cenarro et
al. 2007).
Additionally, the determination of their
fundamental parameters can be difficult for some types of stars and is
itself based on stellar models. Conversely theoretical libraries can
cover a much larger parameter space and at any chosen resolution
(see e.g.
Martins et
al. 2005).
There are still known problems in the
comparison between the observed and theoretical stellar spectra
(Martins and
Coelho 2007).
Two specific examples for problems of theoretical models
are incomplete line lists
(Kurucz 2005),
problematic particularly at high spectral resolution, and the modelling
of the IR emission
(Lançon et
al. 2007),
which is particularly difficult for stars in the luminosity classes I
and II (A. Lançon, talk at workshop). The way forward may be a
synthesizing approach, as suggest by
Walcher et
al. (2009),
aimed at using the strengths of both kinds of
libraries. As with the evolutionary tracks, most libraries
are limited to single compositions for a given metallicity. However
recently this also has been changing, with stellar libraries exploring
abundance changes such as
-enhancement as well (e.g.
Coelho et
al. 2007).
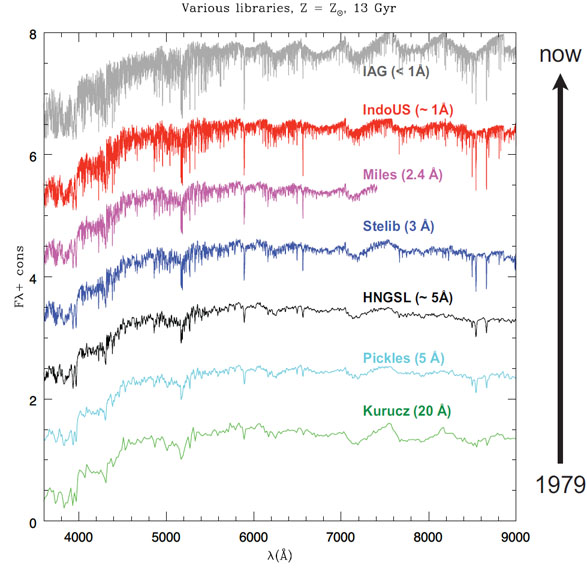 |
Figure 2. Optical spectra from both theoretical and empirical stellar libraries (as labelled) demonstrating the improvement of spectral resolution over time with the associated improvement in library size [Courtesy S. Charlot]. |
It is not much of an overstatement to say that the magic of stellar population evolutionary synthesis spectrophotometric codes lies in interpolation. Indeed, to go from evolutionary tracks to isochrones (quoting Maeder and Meynet 1988) "the interpolation between evolutionary tracks must be properly based on point of corresponding evolutionary status" (see also Prather 1976), and similarly to go from an isochrone to SSP SED, the correct, often interpolated, spectrum must be found for each mass bin. These stellar population synthesis (SPS) codes, using stellar evolutionary tracks and stellar libraries, then calculate Equation 1. Besides interpolation, the challenge is to create the most homogeneous and most accurate set of input ingredients, interpolating in an appropriate manner when necessary in dependence on the coverage and strengths of these sets. Stellar population models predicting full spectra include Fioc and Rocca-Volmerange (1997, PEGASE), Bressan et al. (1998, used in GRASIL) and Leitherer et al. (1999) and Vázquez et al. (2007) (both Starburst99), Vazdekis (1999), Schulz et al. (2002), Cerviño et al. (2002), Robert et al. (2003), Bruzual and Charlot (2003, GALAXEV, also commonly referred to as BC03), Le Borgne et al. (2004, PEGASE-HR), Maraston (2005, M05, based on fuel consumption theorem), Lançon et al. (2008), Mollá et al. (2009). Currently less frequently used are fully theoretical stellar population models such as González Delgado et al. (2005), Coelho et al. (2007). However, as recently shown by Walcher et al. (2009), a combination of semi-empirical and fully theoretical models holds great promise for the future. As a result of the improvements in stellar evolutionary tracks and stellar libraries, as well as the codes themselves, stellar population synthesis models today can recreate broad-band UV to NIR SEDs and high-resolution spectra in the optical remarkably well.
2.1.2. Validation of SSP predictions
As SSP spectra form the basis of all fitting of galaxy SEDs and as the complexities of real galaxies may introduce degeneracies and further uncertainties in the resulting interpretations, it is of primary importance to validate directly the predictions of the stellar population synthesis models for SSPs (see e.g. Bruzual A. 2001). For the impact of uncertainties in the stellar parameters effective temperature, surface gravity, and iron abundance on the final SSPs see Percival and Salaris (2009).
The ideal testbed for such validations are simple stellar populations occurring in nature, i.e. co-eval stellar populations such as globular clusters (GCs), open clusters, and young star clusters. These objects have been used as such for some time (e.g. Renzini and Fusi Pecci 1988, González Delgado and Cid Fernandes 2010), but unfortunately, the exact equivalence between star clusters and SSPs breaks down for a number of reasons:
1) In star clusters, the stellar populations are affected by the dynamical evolution of the cluster, which leads to mass segregation, and evaporation of low-mass stars in GCs and, in young star clusters, the expulsion of gas early in their life time may lead to dissolution (open clusters) or to the loss of a significant number of stars (though see Anders et al. 2009 for recent work on dealing with this in SSP models).
2) Clusters also contain exotic stars (e.g. blue straggler stars, discussed in the following section) which influence the integrated light of the cluster but are not accounted for by most population synthesis models (though see Xin et al. 2007 for a discussion on how to account for these).
3) Finally, star clusters only have a finite number of stars. In a less
than 105
M
star cluster, the number of bright stars is so small, that stochastic
fluctuations in the photometric properties of the cluster are common
(Barbaro and
Bertelli 1977,
Lançon and
Mouhcine 2000a,
Cerviño and
Luridiana 2004,
Cerviño and
Luridiana 2006,
Piskunov et
al. 2009).
In the study of individual clusters, most of these problems might be
alleviated by concentrating on the most massive specimens (W3,
 Cen, starburst
clusters), but these have the tendency to exhibit multiple rather than
single (simple) stellar populations (e.g.
Lee et al. 1999).
Thus, one needs to study star cluster populations
for comparison with SSP models and to account for the influence
of the stochastic fluctuations on the color-luminosity
distribution. Looking the other way around, within a given error box for
the observed colors, a complex distribution of possible ages is possible
(Fouesneau et al., talk at workshop). While multi-wavelength
observations help, they do not completely eliminate the problem.
Cen, starburst
clusters), but these have the tendency to exhibit multiple rather than
single (simple) stellar populations (e.g.
Lee et al. 1999).
Thus, one needs to study star cluster populations
for comparison with SSP models and to account for the influence
of the stochastic fluctuations on the color-luminosity
distribution. Looking the other way around, within a given error box for
the observed colors, a complex distribution of possible ages is possible
(Fouesneau et al., talk at workshop). While multi-wavelength
observations help, they do not completely eliminate the problem.
2.1.3. Current Issues with SSPs
Even though significant improvements in the evolutionary tracks and stellar libraries have been made in the last decade, significant challenges remain, as some parts of stellar evolution are only weakly understood, and hence poorly treated. The most important of these tend to be short lived but bright phases: massive stars, thermally pulsing asymptotic giant branch (TP-AGB) stars, extreme horizontal branch stars (EHB) and blue stragglers.
Massive stars, due to their rapid evolution and short lifetime, prove to be difficult to model and observe at all phases. Additional difficulties arise in that they tend to be buried by the interstellar material that they formed from for a large fraction of their lifetime, and experience high stellar winds (and hence strong mass evolution over their lifetime). Yet massive stars are a vital component of SSP modelling because they are so luminous and can thus dominate a SSP spectrum, and because they give rise to most of the ionizing flux and resulting nebular emission-line contribution. Previous modelling of massive star evolution paid particular attention to the size of the convective core and stellar mass loss, yet recent theory has indicated the significant, if not dominant, role that stellar rotation has on the evolution of these stars (Meynet and Maeder 2005). Vázquez et al. (2007) show in their recent stellar population model that, as rotating stars tend to be bluer and more luminous than in earlier models, even the ionizing spectrum can be significantly altered. These differences have consequences when interpreting the SEDs of young galaxies, such as decreasing the determined mass or star formation rates.
TP-AGB stars are short-lived, cool but luminous components of evolved stellar populations that tend to be more prominent at low metallicities. Due to the short lifetime of this stellar phase, as well as the inherent instability of the pulsations, such stars are difficult to model. Yet due to their relatively high luminosities (see figure 3) they can significantly alter the mass-to-light (M* / L) ratio of intermediate-age populations and it is thus important to properly include them. Previously, several different theoretical and semi-empirical recipes had been used in stellar population synthesis models leading to large discrepancies between SSP spectra (Vassiliadis and Wood 1993, Maraston 1998). Attention has been focused on these stars since Maraston (2005) raised this issue, leading to rapid progress in the modelling (Marigo and Girardi 2007), largely reducing these differences in the broad-band photometry.
 |
Figure 3. Effective stellar temperature
versus luminosity diagram showing stellar evolutionary tracks, with the
problem/uncertain areas marked. As a basis, the Padova
(Marigo et
al. 2008)
tracks for 0.1 to 15
M |
The emission of SSPs near 10 Myr is dominated by luminous red supergiants, showing that more problems exist in the NIR than only TP-AGB stars. At higher spectral resolution in the NIR, comparisons of SSPs based on different libraries of synthetic stellar spectra and different isochrones show large residuals in the whole range from 1 to 2.5 µm and in particular for young to intermediate ages (A. Lançon, talk at workshop). Additionally, ages derived from NIR and optical spectroscopy are discrepant by factors of two in this age regime. Resolving these problems will surely lead to improved predictions of stellar population models at all wavelengths.
EHB stars represent the most luminous hot component in old stellar populations. Understanding these stars and implementing them in SSP codes is important because they could be mistaken for low-level star formation in more evolved, early-type galaxies. Unfortunately, the evolution of EHB stars is not fully understood. While HB morphology may be dependent upon metallicity, some metal-rich stellar populations show HB stars bluer than expected (Heber 2008). The second-parameter problem with the morphology of the horizontal branch (for a review see Catelan 2009) will need to be solved before significant progress can be expected in this field. Meanwhile, the comparison between model SSP spectra and the data at old ages is affected by these uncertainties (Ocvirk 2010).
Blue straggler stars are, as the name suggests, stars that extend beyond the main sequence turn-off. Their origin is still unknown, though it is believed to be associated with binary star evolution, either through mass transfer or merging (Tian et al. 2006, Ferraro et al. 2006). As with EHB stars, blue stragglers can affect the interpretation of early-type spectra giving younger average ages. These stars point towards a fundamental limitation of current SSP modelling, in that effects of binary evolution are not included. While this causes little difference in most cases, in some situations (such as where blue stragglers may dominate) recent binary stellar population models may be more suitable (Han et al. 2007).
The reader is also referred to the series of papers Conroy et al. (2009), Conroy and Gunn (2010b) for a recent systematic study of some of the uncertainties affecting SSP models.
Yet, even with all these remaining issues, SSP modelling has advanced significantly in recent years, with simple Charlot & Bruzual (2010, in preparation) exponentially-declining SFH + burst models able to reproduce 1000's of optical SDSS spectra (of ~ 5Å resolution) to a few percent (see Section 4.4.4).
SSP models are state of the art for producing the spectra of stellar populations, yet they are not sufficient alone for reproducing the spectra of galaxies. Stars are the dominant power sources within galaxies (excluding AGN). However, the radiation from stars is absorbed and processed by the gas and dust that lies between the stars, the interstellar medium (ISM). This absorption must be accounted for when comparing SSP models with optical/UV observations and a treatment of the radiative transfer of the stellar light through the ISM and subsequent ISM emission is necessary if the full UV-IR SED is to be understood.
While the gas and dust are in reality intermingled within the ISM, in practice they are often treated as separate components because their absorption properties have a different wavelength dependence.
Interstellar gas is predominantly treated as atomic in the modelling of galaxies. While molecular gas is clearly present in many galaxies, it has generally a low volume filling factor, meaning that rarely contributes significantly to the overall opacity in a galaxy. It is only a noticeable opacity source in specific spectral features or in galaxies dominated by nuclear/heavily obscured sources, such as AGN and ultra-luminous IR galaxies (ULIRGs). Molecular gas emission in galaxies is predominantly seen at longer wavelengths (NIR and longer) and is generally treated to arise mostly from "Photodissociation Regions", where the gas is heated by the diffuse interstellar radiation field of the galaxy. Although it provides insight into the molecular phase of the ISM, molecular emission is not considered to be a significant contributor to the overall SED of a galaxy (for further details see reviews by e.g. Young and Scoville 1991, Hollenbach and Tielens 1997).
Atomic gas however is the dominant opacity source in the
extreme-UV ( 13.6
eV). It reprocesses this light into strong
emission lines in the UV, optical and IR. It is thus especially important
for young, actively star-forming galaxies.
Usually, it is assumed that all hydrogen ionizing photons
(h > 13.6 eV) are
absorbed locally, within a small volume around the ionizing sources
(approximately the Strömgren
sphere 1),
which is appropriate due to the high opacity in this wavelength regime.
This energy is then re-emitted in the hydrogen recombination lines,
which correlate directly with the total number of ionizing photons
(see e.g.
Storey and Hummer
1995,
Leitherer et
al. 1999).
However to determine the emission from other elements, or to take
account of both gas and dust absorption, full radiative transfer is
needed using photoionization codes such as CLOUDY
(Ferland et
al. 1998)
or Mappings III
(Groves et
al. 2008).
For further details, see reviews by
Ferland (2003)
and
Stasinska
(2007).
13.6
eV). It reprocesses this light into strong
emission lines in the UV, optical and IR. It is thus especially important
for young, actively star-forming galaxies.
Usually, it is assumed that all hydrogen ionizing photons
(h > 13.6 eV) are
absorbed locally, within a small volume around the ionizing sources
(approximately the Strömgren
sphere 1),
which is appropriate due to the high opacity in this wavelength regime.
This energy is then re-emitted in the hydrogen recombination lines,
which correlate directly with the total number of ionizing photons
(see e.g.
Storey and Hummer
1995,
Leitherer et
al. 1999).
However to determine the emission from other elements, or to take
account of both gas and dust absorption, full radiative transfer is
needed using photoionization codes such as CLOUDY
(Ferland et
al. 1998)
or Mappings III
(Groves et
al. 2008).
For further details, see reviews by
Ferland (2003)
and
Stasinska
(2007).
As both the number density and absorption cross-section of dust is low
relative to hydrogen in the EUV, dust is often ignored as an opacity
source. However, as hydrogen absorption is limited by the
recombination rate, dust absorption becomes relatively more important
as the strength of the ionizing radiation field increases, becoming
the dominant EUV-opacity source when q(H0) >
B /
 ~ 5
× 108 cm s-1
assuming typical values for the dust opacity,
(Dopita et
al. 2002).
This value of the ionization parameter q is well above the average
value measured for star-forming galaxies (see e.g.
Kewley et
al. 2001),
meaning negligible EUV absorption by dust in typical H II regions ( <
5%), but such high values may be reached within compact H II regions and
AGN meaning dust will absorb a significant fraction of EUV photons
(Dopita et
al. 2002,
Draine 2010).
~ 5
× 108 cm s-1
assuming typical values for the dust opacity,
(Dopita et
al. 2002).
This value of the ionization parameter q is well above the average
value measured for star-forming galaxies (see e.g.
Kewley et
al. 2001),
meaning negligible EUV absorption by dust in typical H II regions ( <
5%), but such high values may be reached within compact H II regions and
AGN meaning dust will absorb a significant fraction of EUV photons
(Dopita et
al. 2002,
Draine 2010).
Interstellar dust has been a field of constant inquiry since it was first realized that an obscuring material existed between the stars and a large body of research exists on the composition, shape and distribution of dust exists (see Draine 2003 for a detailed review of the field, and some remaining questions about dust).
Most of our understanding of interstellar dust has come locally, from observations within our own Galaxy and the Magellanic clouds, and also through theoretical and experimental laboratory work. It is generally accepted that the grains can be considered to be composed of three different compositions; graphitic/amorphous carbon grains, amorphous silicate grains, and polycyclic aromatic hydrocarbons (PAHs), which may or may not be an extension of the carbonaceous grains. The former two were found to reproduce the observed extinction along different lines-of-sight within our galaxy (Mathis et al. 1977), while the latter were added to explain unidentified emission bands in the mid-IR (Leger and Puget 1984). Other forms of dust have been suggested, such as SiC (Treffers and Cohen 1974), and ice is expected to form on grains in the coldest environments such as deep in molecular clouds, but generally only these forms are considered in the SED modelling of galaxies.
The size distribution of interstellar dust grains is thought to be
power-law in nature, with a distribution N(a)
 a-3.5 or similar, with the average cross-section
dominated by small grains, but mass dominated by large. This slope
arises from both theory
(Jones et al. 1996)
and matching observations
(Mathis et
al. 1977,
Draine and Lee
1984,
Weingartner
and Draine 2001).
a-3.5 or similar, with the average cross-section
dominated by small grains, but mass dominated by large. This slope
arises from both theory
(Jones et al. 1996)
and matching observations
(Mathis et
al. 1977,
Draine and Lee
1984,
Weingartner
and Draine 2001).
To obtain the optical data used for dust calculations in SED modelling, the size distribution and types are then convolved with absorption/emission cross-sections and scattering cross-sections and phase functions which are determined by both laboratory observations and Mie theory (see Draine and Li 2007a, Zubko et al. 2004 and references within). PAHs are treated slightly differently as their composition is not fully understood, and their properties can change significantly with the charge of the grains, and thus have more empirical based treatments (see e.g. Weingartner and Draine 2001). Altogether these form the dust models which are used most often in SED modelling, such as Draine and Li (2007a) or Zubko et al. (2004), that have been successfully compared with determined depletion patterns within the ISM and observations in the UV, optical, and IR. These models are either used as an ensemble of individual grain sizes, or integrated to give the opacity data of dust as a whole. Of course empirically based laws and templates are also often used in SED modelling such as the Milky way extinction law and Calzetti law (see below).
For the purposes of
SED modelling and fitting, dust absorption and scattering, and dust emission
are often treated as distinct components. As the hottest dust is
constrained by sublimation to
 2000 K
(corresponding to ~ 3-4µm peak emission), in practice only
the scattering and absorption of light needs
to be considered for modelling the optical-UV emission of galaxies.
Conversely, as dust opacity strongly decreases with increasing
wavelength, in the far-infrared (FIR) only dust emission needs to be
considered.
2000 K
(corresponding to ~ 3-4µm peak emission), in practice only
the scattering and absorption of light needs
to be considered for modelling the optical-UV emission of galaxies.
Conversely, as dust opacity strongly decreases with increasing
wavelength, in the far-infrared (FIR) only dust emission needs to be
considered.
Attenuation by dust
The effects of dust on the optical-UV light are often described
by two parameters - the reddening and total obscuration.
Reddening is the wavelength dependence of dust effects, including
features, and takes account of the fact that shorter wavelength
photons are more readily scattered and absorbed by dust. This is often
parametrized by the color excess E(B - V) or the
Balmer decrement
H /
H .
The total obscuration is a measure of the total light absorbed or
scattered out of our -line-of-sight by dust either bolometrically or
in a single band and can be considered the normalization of the
reddening. This is generally parametrized as A(V). For
relative measures correcting only for reddening is sufficient, however for
absolute quantities the total obscuration must also be taken into
account. This is especially important when the reddening is close to flat,
i.e. only small visible effects by dust on the spectrum.
.
The total obscuration is a measure of the total light absorbed or
scattered out of our -line-of-sight by dust either bolometrically or
in a single band and can be considered the normalization of the
reddening. This is generally parametrized as A(V). For
relative measures correcting only for reddening is sufficient, however for
absolute quantities the total obscuration must also be taken into
account. This is especially important when the reddening is close to flat,
i.e. only small visible effects by dust on the spectrum.
For individual stars in the Milky Way, the Large and Small Magellanic clouds, extinction laws have been measured (e.g. Cardelli et al. 1989). However, when considering a galaxy as a whole, it must be taken into account that stars reside at different optical depths, depending on whether they lie on the side of the galaxy facing the observer or averted from the observer, and that the stellar light can be scattered into the observer's line-of-sight as well as out of it. Additionally, stellar populations of different age will have different extinction optical depths, and this extinction might have a different wavelength dependence. These issues lead to the concept of `attenuation', where the complexity of the actual star-gas geometry is wrapped into a single attenuation law, now not applied individually to each star in the galaxy, but applied to the full spectrum of the galaxy.
Using an attenuation law, the dust obscuration of stellar light is
expressed through a screen approximation (see Equation 2),
as if the dust was lying between us and the stellar population of the
galaxy, with a wavelength-dependent reddening law
(a).
The total amount of attenuation then depends only upon the thickness of
the screen (
 ),
),
 |
(2) |
The attenuation law was derived empirically for starburst galaxies by
Calzetti et
al. (1994),
Calzetti (1997)
who fit the law with a simple polynomial as a function of 1 /
. They found a law much
greyer than the extinction laws of the Milky Way and LMC demonstrating
the effects of geometry and mixing compared to simple
extinction. Generally an simple power-law ,
a
-0.7, is
able to reproduce the observed effective attenuation in galaxies
(Charlot and Fall
2000).
However, a simple attenuation law cannot account for differential geometries and star formation histories within and between galaxies. This can be seen with the higher optical depths observed for nebular emission lines relative to the underlying stellar continuum, indicating that the stars and gas that give rise to the lines and to the continuum see different amounts of dust (Calzetti et al. 1994, Calzetti 1997). These observations led to the improvement over a simple attenuation law in the approaches of Silva et al. (1998) and Charlot and Fall (2000), who created a more physical two-step model in which young stars which emit ionizing photons are likely to be still surrounded by the clouds of gas and dust from which they formed. In this model all stars are attenuated by `diffuse' dust in the same manner as equation 2. However young ( < 10 Myr) stars undergo an additional `birth cloud' attenuation. In practice this means that the UV light and nebular emission lines associated with the short-lived massive stars are more obscured than the optical light dominated by the longer-lived stars, as observed in real galaxies.
While the empirically calibrated Charlot and Fall (2000) model is an improvement over a simple attenuation law, it still does not take account of the differential dust and star geometries that are clearly visible in resolved galaxies, such as bulges, disks, and dust lanes. The clumpiness of the ISM, both within the diffuse phase (see e.g. Kuchinski et al. 1998, Witt and Gordon 2000) and within the birth clouds (see e.g. Popescu et al. 2000, Dopita et al. 2005), will also affect the resulting attenuation of galaxies. However the greatest difficulty that simple, empirically-based attenuation laws face is the anisotropic scattering of light by dust, as photons are not only scattered out of the line-of-sight, but can also be scattered into it. This can cause bluer integrated spectra than can be accounted for by simple attenuation laws, especially for face on galaxies (see e.g. Baes and Dejonghe 2001b, Fischera et al. 2003, Pierini et al. 2004, Inoue et al. 2006).
However, to take account of all these issues, proper radiative transfer (RT) calculations must be done, which require intensive computations. To limit these calculations several treatments exist, which can be broadly grouped into iterative methods and Monte Carlo methods (for a more detailed description for several of the methods used in RT calculations, see Baes and Dejonghe 2001a). In the iterative approach, the light is broken up into emitted and scattered components, with the RT equation solved separately for each component, and the solution from the previous component being used for the subsequent (i.e. directly emitted photons by stars, then photons scattered once by dust, photons scattered twice etc.) and these equations iterated to convergence (see e.g. Kylafis and Bahcall 1987, Xilouris et al. 1998, Xilouris et al. 1999, Tuffs et al. 2004). Monte Carlo methods use a method closer to reality, where the paths of individual 'photons' are followed through their interactions (absorption and scattering) through the galaxy. The photons are emitted in a random direction from the sources, such as stars, and interact randomly with the surrounding ISM with a certain probability based on the mean free path length, and are followed through these scattering events until the photons escape or are absorbed. To build up an integrated SED of a galaxy, many photons must then be followed, though many treatments now exist to limit this number, such as only following photons which end up in the observer's line of sight (see e.g. Witt et al. 1992, Bianchi et al. 1996, Witt and Gordon 1996 for some early work on Monte Carlo RT in galaxies). Both of these approaches are currently used, with the iterative quicker for given geometries, while Monte Carlo is more able to handle complex distributions of stars and dust (several existing codes are discussed in the following section).
While obviously the most realistic approach, the limitation of the radiative transfer is that it requires complex calculations and thus it is not directly applicable to large sample of galaxies. RT codes have been used to provide template libraries of attenuation for a range of galaxies (Bruzual A. et al. 1988, Ferrara et al. 1999, Pierini et al. 2004), and also analytic functions for the attenuation of the components of galaxies (i.e. bulge, disk, clumps etc., Tuffs et al. 2004), to deal with this issue, yet these introduce several free parameters which may be difficult to determine for unresolved galaxies for which only broad-band SED is available. It is for these reasons that a simple attenuation law is still the most commonly used way to account for the effects of dust on the UV-optical SED.
One final note about the attenuation by dust is the silicate dust features that can appear in absorption at 9.7 and 18 µm. These features require large optical depths to be observed, and thus are generally only seen in galaxies with strong nuclear sources (i.e. nuclear starburst/AGN). As this absorption occurs againstmodeled dust emission, it is usually only modeled with a simple absorbing screen, otherwise it requires self-consistent radiative transfer (discussed in section 2.2.3).
Emission by dust
Dust emission in the FIR and sub-mm is most commonly modeled by a single
black body (FFIR
B(Tdust))
or emissivity-modified black body
(
B(Tdust)
-, also
called grey body), or a simple sum
over a limited (2-3) number of these. The first form assumes that all
dust is in thermal equilibrium at one temperature Tdust.
The emissivity of dust grains is generally taken to be a
power-law at these long wavelengths, with models and
laboratory data suggesting indices ranging from
= 1.0 -
2.0. Actually the
index is
expected to be a function of both grain size, composition and
temperature (see e.g.
Andriesse 1974,
Draine and Lee
1984,
Agladze et
al. 1996,
Mennella et
al. 1998
with a nice discussion on the constraints on
in the
latter). When introducing more than one black body, one is generally
limited by the number of wavelengths observed and the details of the
model (see e.g.
Dunne and Eales
2001).
In general, two modified black-bodies are
sufficient to model these wavelengths, encompassing the idea
of warm and cold components of the ISM (see e.g.
Popescu and Tuffs
2002,
Hippelein et
al. 2003,
and the review by
Sauvage et
al. 2005).
In the MIR range simple black bodies are not sufficient and more detailed modelling is necessary. This is due to strong dust (PAH) emission features and the stochastic heating processes that become important for smaller dust grains. As the size of a dust grain decreases, the impingement of photons onto the dust grain surface becomes less frequent and more random, thus less statistically representative of the interstellar radiation field, allowing significant cooling between photon impacts (Figure 13 of Draine 2003). Thus, rather than having a single temperature, the dust has a range of temperatures and is parametrized rather by the strength of the radiation field heating it. To model this one can use either Monte Carlo calculations simulating the arrival of photons and subsequent emission, or more simply one assumes and solves for a steady-state distribution of temperatures given the strength and shape of the impinging radiation field and dust size and composition (see e.g. Guhathakurta and Draine 1989, Desert et al. 1990, Draine and Li 2007a). Once this temperature distribution is known, it can be convolved with black bodies modified by the dust emissivity in the MIR, including any features.
Polycyclic aromatic hydrocarbons (PAHs) could be either called the largest molecular species or the tiniest dust - emit strong features in the MIR (see e.g. Smith et al. 2007). These features arise from specific bending and stretching modes of the large aromatic molecules (Bauschlicher et al. 2009). As PAH emission bands are so complex they are generally incorporated into the models by either assuming a template form for the MIR emission features (see e.g. Desert et al. 1990) or by modelling the physical processes in a way similar to the small dust grains (e.g. Weingartner and Draine 2001, Draine and Li 2007a). On the whole, while aromatic molecules within galaxies are accepted to be the source of the MIR features, the typical shapes, sizes, and ionization-charges of these molecules are an active field of research.
More realistic FIR dust emission models must take into account that the dust within the ISM of galaxies will exhibit a range of temperatures, from the hot dust around young stars and in outflows to the coldest dust in cold molecular cores, driven by the range of radiation fields and dust sizes. Such complex emission models calculate, for a given radiation field, the emission from each grain size and composition and then integrate over these for a given dust distribution to obtain the total dust emission. The largest grains are generally considered to have a single temperature, as they will be in thermal equilibrium, leading to a simple distribution of temperatures dependent upon grain size and composition. In more accurate models, the smallest grains are considered to be stochastically heated and the temperature distribution of the individual grains is calculated (using, e.g., the treatment of Guhathakurta and Draine 1989). To finally calculate the IR emission from a galaxy, the distribution of dust masses over heating radiation field are also needed. Simpler IR emission models assume a functional form of dust mass over heating intensity; dMd = f(U)dU, with f(U) most often assumed to be a power law (see e.g. Dale et al. 2001, Dale and Helou 2002, Draine et al. 2007b). The most complex IR emission models use radiative transfer to calculate the radiation field distribution over a galaxy, where the distribution of dust and stars are assumed (i.e. parameters of the model), and thus these models directly link the dust absorption and dust emission. These are discussed in Section 2.2.3.
However, as the temperature distributions of the dust in the galactic ISM are dependent upon dust-gas geometry and cannot be determined from optical-UV data alone, empirically-based templates are often used for representing the IR SED of galaxies, especially when IR data is limited due to sensitivity or confusion. These templates take dust models as described above (i.e. multiple modified black bodies, or dust heated by a range of radiation fields) and match these to observed IR SEDs (or IR colors) of groups of galaxies. These templates then tend to have galaxy-wide properties such as IR luminosity or galaxy type as parameters, though intrinsic properties such as average interstellar radiation field intensity are also used. Well known examples of templates include those of Chary and Elbaz (2001), Dale and Helou (2002), Lagache et al. (2004), and, more recently, Rieke et al. (2009). Though these templates tend to be limited by the samples that define them, they provide a good alternative to models when no or very little information is available about the actual IR emission of a galaxy.
2.2.3. Combining stellar and dust emission
The full UV to IR SED of a theoretical galaxy can be created through the combination of the techniques and modelling discussed in the previous sections (2.1-2.2.2). However, the different wavelength regimes need to be consistently connected. The simplest method is to take the energy absorbed in the optical-UV (see Equation 2) and to distribute it across the MIR and FIR, assuming simple emission properties for the dust, such as black bodies. This is the method used by Devriendt et al. (1999) and da Cunha et al. (2008). These authors attempt to strike the balance between the capability to model large datasets and the minimum sophistication necessary for a realistic model.
To associate full UV-submm SEDs with their semi-analytic models (discussed in the following section) Devriendt et al. (1999) created "STARDUST". This model assumes that stars and dust are homogeneously-mixed in the galaxy. The light from the stars, i.e. summed from SSPs, is then passed through an ISM with the amount of dust determined from a simple galaxy chemical evolution model. The dust-absorbed radiation is then re-emitted via a series of templates generated from the Desert et al. (1990) model and fitted to observed IRAS points, parametrized by the total IR luminosity.
da Cunha et al. (2008) follow a similar idea, but improve upon this by using the Charlot and Fall (2000) recipe for the attenuation. They thus obtain naturally corresponding `birth cloud' and `diffuse ISM' dust emission components over which the absorbed energy is distributed (see Figure 4). The two emission components are both made up of a PAH template and variable grey body contributions, with the birth cloud emission consisting of shorter wavelength (hotter dust) emission. Such a model can simultaneously determine quantities such as stellar mass and dust mass of a galaxy, and provide quantitative uncertainties for all parameters (see section 4.1). While this method is quick, and hence suitable for comparison against large datasets, it is self-consistent across the two emission components only in terms of the total amount of radiation absorbed and re-emitted; physical properties, such as the dust temperature or the shape of the emission within the components, are based on educated assumptions and are not constrained directly by the optical-UV absorption in the model.
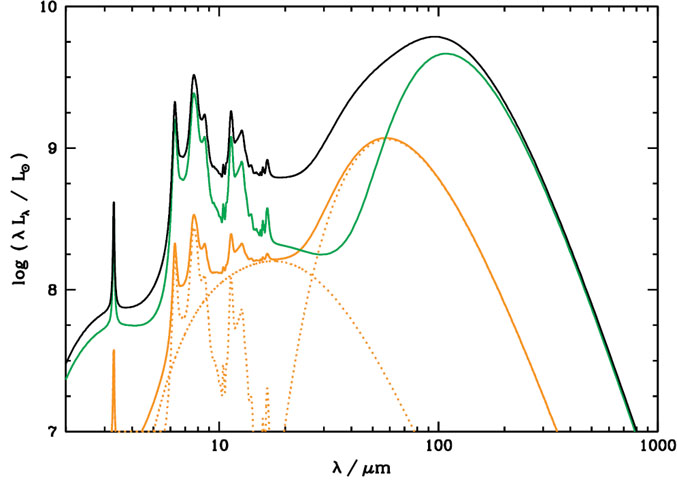 |
Figure 4. IR emission of a simulated galaxy from the da Cunha et al. (2008) model (black curve) demonstrating the individual contributions from the `birth cloud' dust (orange) and `diffuse ISM' dust (green) [Courtesy E. da Cunha]. |
A very similar method was followed by Noll et al. (2009) with the CIGALE code, which uses either the Maraston (2005) or PEGASE codes for the stellar populations and only a Calzetti attenuation law to attenuate the stellar light. The major differences lies in the use of existing empirically calibrated templates, such as from Dale and Helou (2002), rather than a free IR emission made up of several parameter-controlled components.
To be properly self-consistent, the absorption and emission must occur more `simultaneously', such that the exact temperatures (including stochastic effects) of the dust causing the absorbing can be directly calculated. Such models require radiative transfer calculations to be performed, such that the exact radiation field, or at least the heating intensity, is known at each point in the dusty ISM. This, along with assumptions about the stellar ages and distribution, and the dust distribution and properties can then give the full UV-IR SED of a model galaxy.
The models of Efstathiou et al. (2000) and Siebenmorgen and Krügel (2007) do this radiative-transfer calculation using the ray-tracing method for starburst galaxies, which, being dominated by young stars and their birth clouds, are well represented by simple spherical approximations. These models build upon a strong history of dust radiative transfer and emission modelling and star-formation region modelling work to create simple models for the understanding of the UV-submm SEDs of starburst galaxies (Rowan-Robinson 1980, Rowan-Robinson and Crawford 1989, Rowan-Robinson 1992, Siebenmorgen and Kruegel 1992a, Siebenmorgen et al. 1992b, Rowan-Robinson and Efstathiou 1993, Siebenmorgen 1993, Krugel and Siebenmorgen 1994). These works are based on the observation that young stars are both relatively more luminous and more obscured (thanks to the birth clouds) than older stars, and that in strongly star-forming galaxies these young stars will be the dominant IR (and significant bolometric) sources. In particular, Siebenmorgen and Krügel (2007), reduce the results of complex modelling to a series of templates, based upon the physical properties of starbursting galaxies, such as the total luminosity, size and extinction of the star-forming regions and the contribution of the young stars to the total luminosity of the galaxy.
Groves et al. (2008) (building on previous works; Dopita et al. 2005, 2006a, b), take this work a step further by self-consistently calculating the emission of a star-forming region, including the radiative transfer through the surrounding gas and dust simultaneously. Like Efstathiou et al. (2000) they allow for the H II regions to evolve over time, using empirically calibrated models. This model is well suited for modelling starburst (star-formation dominated) galaxies, where young stars and their 'birth clouds' dominate the emission, determining conditions such as star-formation rate and compactness of the gas and stars. Like da Cunha et al. (2008) and Siebenmorgen and Krügel (2007) it provides physical templates with as few parameters as possible. Yet, while it fits well the SEDs of star-formation dominated galaxies (see Figure 5), this model is not suited for non-starbursting galaxies, where the distribution of the diffuse dust and stars must be accounted for.
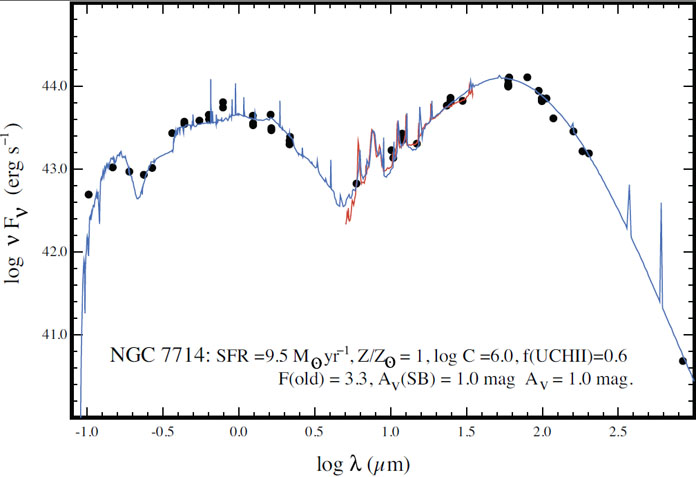 |
Figure 5. Groves et al. (2008) model fit (blue curve) of the starburst galaxy NGC 7714 SED (black points and red curve mid-IR spectra), demonstrating the determination of physical galaxy properties such as star-formation rate (SFR) and metallicity (as labelled, see Groves et al. 2008 for full description of parameters) [Courtesy M. Dopita]. |
By assuming a simple molecular cloud-disk-bulge geometry (as shown in figure 6), the GRASIL model (Silva et al. 1998, Granato et al. 2000) is able to account for the differential extinction suffered by the stars of different ages associated with each of these components in a galaxy. In addition, by varying the contribution of each component, galaxies from spirals to ellipticals can be modeled. Unfortunately, the more general geometry means that some parts (such as the gas-dust connection calculated in Groves et al. 2008) cannot be calculated, and also means more parameters are needed to define the model. As with the Groves et al. (2008) model, the more accurate dust calculations mean a longer calculation time, as compared with simpler models such as da Cunha et al. (2008). The GRASIL team is currently working on speeding up their calculations for semi-analytic models (see following section) by the use of neural networks (Silva et al. 2010).
 |
Figure 6. Sketch of the geometry assumed within the GRASIL model (Figure 1 from Granato et al. 2000). |
The main issue with all models discussed above is that, while they take account of absorption (and emission) reasonably well, they do not accurately take account of dust scattering, which, as discussed above, can make some galaxies appear bluer or redder depending upon inclination. This can be even more obvious in spatially resolved SEDs of galaxies, where light from stars which are obscured along our line of sight can be seen in reflection. However, as scattering is an inherently stochastic process, it is difficult to model simply in a galaxy, especially when multiple scatterings can occur.
Tuffs et al. (2004), following on from Popescu et al. (2000) and Misiriotis et al. (2001), use the iterative ray-tracing radiative transfer method of Kylafis and Bahcall (1987) to efficiently calculate the radiation field throughout model galaxies consisting of a stellar bulge, stellar and dusty disks and dusty clumps. Their resulting SEDs are then self-consistent across the UV-IR range. In addition, one of the strong benefits of radiative transfer is that the resulting SEDs can also be spatially resolved, and be compared to multi-wavelength studies of resolved galaxies, which they have done with edge-on galaxies such as NGC 891 (Popescu et al. 2000) and NGC 5097 (Misiriotis et al. 2001).
The other common approaches is to use the Monte-Carlo radiative transfer method to model the UV-IR SED of galaxies. Existing Monte-Carlo codes that have been applied to galaxies include SUNRISE (Jonsson 2006, Jonsson et al. 2010), DIRTY (Gordon et al. 2001, Misselt et al. 2001), TRADING (Bianchi et al. 1996, Bianchi et al. 2000, Bianchi 2008), SKIRT (Baes et al. 2003), and RADISHE (Chakrabarti and Whitney 2009). These are able to model arbitrary and complex geometries of dust and gas, including spiral arms, dust lanes, bulges and clumpy ISM. However unlike the ray tracing method, the radiation field within the galaxy is not directly calculated (as only individual photons or photon packets are followed). Thus dust heating and emission must be treated through approximations (discussed in detail within the papers listed above). One treatment is to integrate within set volumes (i.e. a grid) the amount of energy absorbed by dust, and to redistribute this energy over large equilibrium grains. In some cases (Bianchi et al. 2000), small stochastic grains are also considered (using template assumptions). This approach can suffer from stochastic noise if the number of photons used is not sufficient. A similar treatment is to convert the absorbed energy into a radiation field using the dust cross-sections, and thus with the radiation field known the methods described in the Section 2.2.2 can be used (see e.g. Misselt et al. 2001), though this still suffers from issues of stochastic noise. Another treatment is called the "dust temperature update method". Here, the temperature of the grains is updated with the absorption and emission of each photon (described in detail in Bjorkman and Wood 2001, Baes et al. 2005). All these methods must iterate in the case of self-absorption of dust. A more efficient method iterates on the calculation of the radiation field density by using the previous estimates as a base and only calculating for the difference at each iteration. This method will always converge as each iteration only adds a small amount of dust emission which will provide an even smaller amount of dust emission. The new radiation field is converted to IR emission using models such as Dale and Helou (2002) or Draine and Li (2007a) (see e.g. Juvela 2005, Jonsson et al. 2010). While definitely more accurate in the treatment of dust, Monte Carlo codes require some representation of the ISM as input and are much more expensive computationally, especially in the cases where the dust is optically thick to its own (IR) emission and many iterations may be required. Current models are also, due to resolution effects both within the RT and galaxy models, unable to calculate the absorption on both diffuse (kpc) and local (pc) scales, and thus currently use approximations or sub-resolution models (see e.g. Jonsson et al. 2010). Hence, while reproducing "real" galaxies, they cannot be directly used to fit observations of individual galaxies.
In summary, the modelling of the transfer of stellar light through the ISM is well advanced, yet two significant challenges still exist. The first is simply the computational effort needed to represent the radiative transfer accurately. Many of the above models are limited in their resolution to trace the ISM accurately, and thus need sub-resolution approximations to treat some of the coldest or hottest dust (e.g. SUNRISE uses the starburst templates of Groves et al. 2008). The second is our general lack of understanding of the dust composition in the ISM. Generally, dust is assumed to consist mainly of carbonaceous and silicate-like grains (such as olivine), in some power-law size distribution, (see e.g. Mathis et al. 1977). This form is reasonably well constrained by observations of extinction in the optical-UV and emission features in the IR (see Draine 2003). Yet there are still open questions on shape (how ordered or "fluffy" are the grains, e.g. Zubko et al. 2004), on whether there are other kinds of dust, and on what formation and destruction processes lead to this power-law distribution of sizes (e.g. Jones et al. 1996). Conversely there are still spectral features associated with dust that are yet to be properly explained, such as the 2175Å absorption feature, the diffuse interstellar bands in the optical, and the "Extended Red Emission" band observed around 7000Å (see Draine 2003 for a discussion on these features and other remaining issues).
Together, the SSP and ISM radiative transfer models of the previous sections are able to reproduce the full UV-sub-mm SED of galaxies with a reasonably high degree of accuracy (see e.g. da Cunha et al. 2008, Groves et al. 2008). Yet, by themselves, these models are inherently static. Only limited model assumptions about the past evolution of the galaxy can be introduced through the star formation history. In particular, the ISM is rarely evolved along with the stars, and is presumed to be the same metallicity as the latest generation of stars in the SSP models. It is common form to assume that the dust in the ISM is a constant fraction of the metals within the gas, distributed in a form similar to that found in our Milky Way.
These assumptions are sufficient to reproduce the observed SEDs of real galaxies using empirically based priors (e.g. Section 4.5), or multiple components (e.g. Section 4.4, and see Section 4 for full discussion). However to produce fully-theoretical SED models that are at least conceptually similar to local galaxies, one needs to fall back on galaxy evolution codes. There are three levels of these. At the innermost level are galactic chemical evolution codes, which, given some star-formation history and/or some "pristine" inter-galactic medium (IGM) infall rate, trace the evolution of the ISM metallicity, allowing for outflows, infalls, and pollution by stars (see reviews by Hensler 2008, Matteucci 2008). The more recent of these codes also evolve the dust along with the gas, taking into account the different pollution rates of different elements, and the evolving temperature/phases of the ISM (e.g. Calura et al. 2008). Once these codes have given the corresponding ISM evolution with the star-formation history (input or calculated), these can be associated with SSP and ISM codes to give a more self-consistent instantaneous spectrum of a galaxy (e.g. Schurer et al. 2009, Conroy et al. 2010a). Some of the main issues with these are the limited knowledge of the external gas losses and infalls, meaning that exact evolution cannot be obtained, and the computational time needed to calculate this evolution and associate it with a spectrum, meaning that only specific sets of SFH or infall can be calculated at a time.
The next scale above the chemical evolution models are models that evolve the whole galaxy. These models are based upon hydrodynamic and N-body codes that follow the evolution of the ISM and stars within a dark matter halo representing a galaxy (e.g. Springel 2005). These codes use empirically based relations to follow the detailed evolution, such as the formation of stars from gas, and the feedback from stars to the gas (see e.g. Tormen 1996, Cox et al. 2006). Containing both the stars (or "stellar particles") and the ISM (with known metallicity), these galaxy simulation/evolution codes are perfectly suited for linking with the Monte-Carlo radiative transfer codes such as SUNRISE (Jonsson 2006) or RADISHE (Chakrabarti and Whitney 2009) which have been purposely built to create spectra and broad-band images of these simulated galaxies.
The outermost layer are the cosmological models. These trace the formation of structure in the Universe from the original perturbations in the cosmic microwave background to redshift zero, using N-Body codes to simulate dark matter and its gravitational interaction (see Dolag et al. 2008 for a review). While some of these models trace baryonic matter as well as the dark matter, most trace only the dark matter due to the more complex interactions of baryonic matter. Thus to trace the formation of galaxies within the forming dark matter halos semi-analytic models (SAMs) are used (e.g. Cole et al. 2000, Kauffmann and Haehnelt 2000, Hatton et al. 2003, De Lucia et al. 2004, Somerville et al. 2008). These models use the outputs from the dark matter simulations and approximate the physics of galaxy formation within the dark matter halos by empirical relations (e.g. for gas cooling, star formation, AGN fueling, feedback).
The SAMs return (and trace) the star formation history of each galaxy that is created, including the effects of mergers, as well as the gas content and metallicity of the gas (and stars). These results can be used in association with SSP models (as discussed in section 2.1) to determine the stellar spectra of each galaxy. As little geometrical information is returned by the SAMs, associating the ISM effects on the stellar spectra is more difficult, especially so for the IR emission. For the gas, most tend to use the associated emission lines added to the SSP models (see e.g. Leitherer et al. 1999, Charlot and Longhetti 2001). For dust attenuation, a simple treatment taken by many is to determine the extinction assuming a uniform mixing of the stars and gas in a galaxy, a fixed `template' attenuation curve, and basing the optical depth on either empirical relations between galaxy luminosity (e.g. Kauffmann et al. 1999, De Lucia et al. 2004), or amount of dust in the galaxy (e.g. Guiderdoni and Rocca-Volmerange 1987, Devriendt and Guiderdoni 2000). More advanced treatments include the use of the Charlot and Fall (2000) model (e.g. De Lucia and Blaizot 2007) or attenuation libraries like that of Ferrara et al. (1999), made for such purposes (e.g. Bell et al. 2003b).
For the dust emission, the situation is more challenging. The simplest treatments assume that all of the radiation attenuated in the optical (by the above treatments) are re-emitted in the IR. This radiation is either distributed through modified Planck functions with empirically-calibrated temperatures (e.g. Kaviani et al. 2003) or empirically-based templates (e.g. Guiderdoni et al. 1998, Devriendt and Guiderdoni 2000). Yet such models do not take into account the strong geometrical dependence of dust heating or the strong variations in the spectral shape and they are clearly not self-consistent with the extinction in the optical-UV (see Section 2.2.3).
For self-consistent SED models, the SAMs need to be coupled with radiative transfer (RT) calculations such as GRASIL, which has been done only for a few models (e.g. Granato et al. 2000, Lacey et al. 2008). However one of the main strengths of SAMs is their computational efficiency and speed which allows the calculation of the physical parameters of the many galaxies in large cosmological volumes and over large redshift intervals for many different implementations of the galaxy formation physics. Yet RT is computationally intensive, and severely slows the SAMs, meaning only relatively small volumes were investigated in the SAM-RT models. In addition some of the details necessary for the RT calculations are generally poorly modeled within the SAMs. Thus currently there is a choice between poorly representative but fast, or better modelling and slow (see Fontanot et al. 2009 for an overview). The currently most advanced models choose to compromise by using a RT-based library, empirically linked with the SAMs (Fontanot et al. 2009) or even linked through artificial neural networks to account for the large and complex variations in galactic UV-IR SEDs (Silva et al., in prep).
Models of galaxy SEDs thus exist of varying resolution and complexity, adapted to model everything from individual galaxies or to large catalogs of galaxies on cosmological scales. While at each level of the SED models our knowledge of the important physical processes could be improved, SED modelling today is much more accurate across the wavelength range than it was even a decade ago.
1 The Strömgren sphere is defined as;
Vs = Q(H0) /
(nh2
B), where
Q(H0) is the
total number of ionizing photons, nh is the hydrogen
number density, and
B is the case
B hydrogen recombination rate.
Back.