


The upcoming JWST, together with the next-generation of 30-40m extremely large ground-based telescopes, will revolutionize our picture of the high-redshift Universe. Among the main JWST science goals is the detection of light from the first galaxies, and more generally to elucidate early structure formation at the end of the cosmic dark ages (Gardner et al. 2006). The key predictions concern the expected flux and number densities of the first galaxies, enabling us to assess their detectability with the instruments aboard the JWST (e.g., Salvaterra, Ferrara & Dayal 2011). In carrying out these predictions, a number of challenges still need to be overcome prior to its projected launch in ~ 2015 (see the contributions in Whalen, Bromm & Yoshida 2010). We begin by briefly summarizing the JWST capabilities. A more detailed discussion is made by Gardner et al. (2006) and Stiavelli (2009).
6.1. JWST Instruments and Sensitivities
The observatory will carry out deep field imaging
with the Near-Infrared Camera (NIRCam) and the Mid-Infrared Instrument
(MIRI), as well as medium-resolution spectroscopy with the Near-Infrared
Spectrograph (NIRSpec) and MIRI. NIRCam will have a field of view of
2.2' × 4.4', and an angular resolution of ~
0.03"-0.06" in the range of observed wavelengths
 obs =
0.6-5 µm.
The multi-object spectrograph NIRSpec will carry out
medium resolution (R ~ 100 - 3000) spectroscopy of up to ~
100 objects simultaneously within a field of view of 3.4' ×
3.4', where R
obs =
0.6-5 µm.
The multi-object spectrograph NIRSpec will carry out
medium resolution (R ~ 100 - 3000) spectroscopy of up to ~
100 objects simultaneously within a field of view of 3.4' ×
3.4', where R  obs /
obs /
 obs
is the spectral resolution.
NIRSpec will operate in the same wavelength range as
NIRCam but at lower angular resolution (~ 0.1"). Finally,
MIRI will complement NIRCam and NIRSpec by providing
imaging, low and medium resolution spectroscopy within the range of
observed wavelengths
obs =
5-28.8 µm and fields of view and angular resolutions of,
respectively, ~ 2' × 2' and ~ 0.1" - 0.6".
obs
is the spectral resolution.
NIRSpec will operate in the same wavelength range as
NIRCam but at lower angular resolution (~ 0.1"). Finally,
MIRI will complement NIRCam and NIRSpec by providing
imaging, low and medium resolution spectroscopy within the range of
observed wavelengths
obs =
5-28.8 µm and fields of view and angular resolutions of,
respectively, ~ 2' × 2' and ~ 0.1" - 0.6".
In quoting sensitivities, or flux limits flim, for the
JWST instruments, a signal-to-noise ratio of S / N
= 10 and exposure times of
texp = 104 s are often assumed. These
baseline sensitivities are summarized in table 10 by
Gardner et al. (2006).
Ultra-deep exposures with JWST
may extend to texp = 106 s, which is
comparable to the
HUDF observations, with flux limits being rescaled according to:
flim  1 / (texp)1/2.
Panagia (2005)
contains a useful graphical representation of the JWST
sensitivities, nicely emphasizing the jump in going from the near-IR to
the mid-IR. Approximate numbers, for the deep exposures, are
flim ~ 1 nJy for NIRCam, and 10 times higher for the
MIRI imager; spectroscopic limits are typically two orders of magnitude
higher than the imaging ones. It is customary to also work with the AB
magnitude system
(Oke 1974;
Oke & Gunn 1983).
Specific fluxes,
f
1 / (texp)1/2.
Panagia (2005)
contains a useful graphical representation of the JWST
sensitivities, nicely emphasizing the jump in going from the near-IR to
the mid-IR. Approximate numbers, for the deep exposures, are
flim ~ 1 nJy for NIRCam, and 10 times higher for the
MIRI imager; spectroscopic limits are typically two orders of magnitude
higher than the imaging ones. It is customary to also work with the AB
magnitude system
(Oke 1974;
Oke & Gunn 1983).
Specific fluxes,
f , can then
be expressed as
, can then
be expressed as
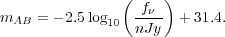 |
(4) |
Even for exposure times as long as 106 s, JWST will
not have sufficient sensitivity to detect sources with stellar masses below
~ 105 - 106
M . In
particular, JWST will not be able to directly detect individual
Pop III stars at high redshifts
(Bromm, Kudritzki & Loeb
2001).
Therefore, starbursts in the first galaxies are
the primary targets for JWST. As was already recognized by
Partridge & Peebles
(1967),
the first galaxies were likely brightest in
the recombination lines of hydrogen and helium
(Schaerer 2002,
2003;
Johnson et al. 2009;
Pawlik, Milosavljevic &
Bromm 2011),
in particular the Lyman-
. In
particular, JWST will not be able to directly detect individual
Pop III stars at high redshifts
(Bromm, Kudritzki & Loeb
2001).
Therefore, starbursts in the first galaxies are
the primary targets for JWST. As was already recognized by
Partridge & Peebles
(1967),
the first galaxies were likely brightest in
the recombination lines of hydrogen and helium
(Schaerer 2002,
2003;
Johnson et al. 2009;
Pawlik, Milosavljevic &
Bromm 2011),
in particular the Lyman- ,
H and
He II 1640 Å nebular emission lines (see
Figure 11).
,
H and
He II 1640 Å nebular emission lines (see
Figure 11).
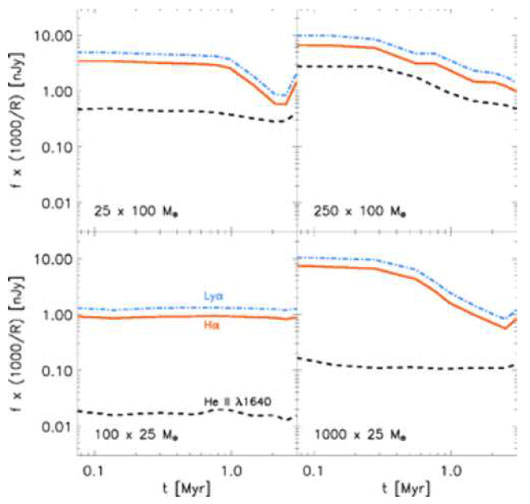 |
Figure 11. Emission line fluxes in the
first galaxies. Shown are predictions for observable
recombination line fluxes as a function of time. The source is an
atomic cooling halo at z
|
The flux from the redshifted He II 1640 Å line
(em = 1640
Å ), as well as the flux from the
redshifted Ly
line (em =
1216 Å ), would
be detected by JWST with NIRSpec at a spectral resolution
of R ~ 1000, whereas the redshifted
H line
(em = 6563
Å ) would be detected with MIRI at a spectral resolution R ~
3000. Finally, the redshifted (soft) UV continuum, at
em
= 1500 Å , would be detected using NIRCam.
6.2. Observing High-redshift Sources
It is convenient to review the basic relations that relate observed to intrinsic quantities, as employed in observational cosmology (see also Loeb 2010).
We begin by translating
intrinsic line and UV continuum luminosities into observed fluxes.
The specific flux from a spatially unresolved object emitted in a
spectrally unresolved line with rest-frame wavelength
em
and intrinsic line luminosity Lem is given by
Oh (1999)
and
Johnson et al. (2009):
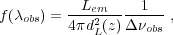 |
(5) |
where obs = c /
(obs
R), and
obs
= (1 + z)
em. A
convenient approximation for the luminosity distance is:
dL ~
100 [(1 + z) / 10] Gpc. For typical parameters, one then has:
 |
Let us now discuss whether the lines, expected to be emitted by the first
galaxies, are indeed spatially and spectrally unresolved.
The assumption of spectrally unresolved lines is excellent
for both H and He II
1640 Å , whose line widths
/
< 10-4
(T / 104
K)1/2 are set by thermal Doppler broadening at
temperature T < 104 K
(Oh 1999).
At redshifts z
 10 a transverse
physical scale
l corresponds
to an observed angle
10 a transverse
physical scale
l corresponds
to an observed angle
 =
l
/ dA ~ 0.1"
(l / 0.5 kpc)
[(1 + z) / 10], where
dA = (1 + z)-2 dL
is the angular diameter
distance. If the recombination lines originate in the
ionized nebulae in the central regions of the first galaxies at
r < 0.1 rvir,
the assumption that the emitting regions are spatially unresolved is also
good for both the H and
the He II 1640 Å lines, and it applies equally
well to the UV continuum. Here, we use a virial radius of
rvir ~ 1 kpc
to describe the overall size of the first galaxies, which is typical for
the systems discussed in Section 4.
In contrast, the Lyman-
line undergoes resonant scattering
(Harrington 1973;
Neufeld 1990),
and hence will originate from within a spatially extended
region with typical angular size
~ 15"
(Loeb & Rybicki 1999),
and be heavily damped due to absorption by intergalactic neutral hydrogen
(Santos 2004;
but see
Dijkstra & Wyithe
2010).
Indeed, Lyman- radiation
from galaxies at redshifts z
10 may be
severely attenuated because the bulk of the Universe was likely still
substantially neutral at these redshifts.
=
l
/ dA ~ 0.1"
(l / 0.5 kpc)
[(1 + z) / 10], where
dA = (1 + z)-2 dL
is the angular diameter
distance. If the recombination lines originate in the
ionized nebulae in the central regions of the first galaxies at
r < 0.1 rvir,
the assumption that the emitting regions are spatially unresolved is also
good for both the H and
the He II 1640 Å lines, and it applies equally
well to the UV continuum. Here, we use a virial radius of
rvir ~ 1 kpc
to describe the overall size of the first galaxies, which is typical for
the systems discussed in Section 4.
In contrast, the Lyman-
line undergoes resonant scattering
(Harrington 1973;
Neufeld 1990),
and hence will originate from within a spatially extended
region with typical angular size
~ 15"
(Loeb & Rybicki 1999),
and be heavily damped due to absorption by intergalactic neutral hydrogen
(Santos 2004;
but see
Dijkstra & Wyithe
2010).
Indeed, Lyman- radiation
from galaxies at redshifts z
10 may be
severely attenuated because the bulk of the Universe was likely still
substantially neutral at these redshifts.
A complementary way to quantify the strength of an observed line
uses (redshifted) equivalent widths, which can easily be translated
into the corresponding rest-frame values (e.g.,
Johnson et al. 2009):
W0 = fline /
f,
where we have used the intrinsic
line and neigboring (specific) UV continuum fluxes. Predicted equivalent
widths for the first galaxies can reach W0
100 Å for He
II 1640 Å , and W0
100 Å for
the hydrogen lines
(Johnson et al. 2009).
6.3. Modelling Star Formation in the First Galaxies
Making predictions for the luminosities and colors of the first galaxies sensitively depends on what one assumes for the stellar populations and star formation model (e.g., Schaerer 2002, 2003; Johnson et al. 2009; Raiter, Schaerer & Fosbury 2010; Pawlik, Milosavljevic & Bromm 2011; Salvaterra, Ferrara & Dayal 2011). One possibility is that stars form in a single instantaneous burst with total stellar mass
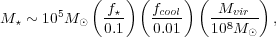 |
(6) |
where fcool is a conversion factor that determines the
amount of gas mass available for starbursts inside halos
with virial masses Mvir, and
f* is the star-formation efficiency,
i.e., the fraction of the available gas mass that is turned into
stars. The parameters are normalized to what we have learned from simulating
the formation of atomic cooling halos (see
Section 4). Specifically,
the choice of fcool = 0.01 reflects the rapid accretion
(tacc < 10 Myr) of large
gas masses (Mgas > 106
M) into
the central regions, as seen in the simulations.
The star formation efficiency may be quite high in a burst mode,
f* = 0.1, where accretion times are comparable
to the typical lifetimes ( ~ 10 Myr) of massive stars. Star formation may
then not be affected by strong feedback capable of
halting the collapse of the accreting gas.
Another possibility is that stars form continuously. Atomic cooling halos,
with their masses of ~ 108
M, may
have potential wells that
are still too shallow to enable continuous star formation
despite the disruptive effects of stellar feedback (see
Section 4). Galaxies with total (virial) masses of
109
M, however,
may have been able to sustain such a near-continuous mode
(Wise & Cen 2009).
One can approximately include the effect
of stellar feedback by employing a lower
efficiency, f* = 0.01, than appropriate for a
starburst. The implied star formation rates
 *(z) ~ 0.1
M
yr-1 are consistent with those found in recent low-mass galaxy
formation simulations
(Wise & Cen 2009;
Razoumov &
Sommer-Larsen 2010).
*(z) ~ 0.1
M
yr-1 are consistent with those found in recent low-mass galaxy
formation simulations
(Wise & Cen 2009;
Razoumov &
Sommer-Larsen 2010).
The luminosities of the first galaxies
critically depend on the metallicities, ages, and IMF of their stellar
populations. Some of the lowest-mass galaxies may still contain
zero-metallicity gas. The resulting stars may form with a
top-heavy IMF, biased
towards high mass (M* ~ 100
M)
stars, as is
expected to be the case for the first, metal-free
generation of stars which form via molecular hydrogen cooling
(Bromm et al. 2009).
The IMF of metal-free stars is, however, still subject to large
theoretical uncertainties. Stars forming out of gas with elevated
electron fractions, such as produced behind structure formation or
SN shocks, or as present in ionized regions, could have
characteristic masses substantially less than < 100
M (see
Section 4).
The assumption of metal-free star formation will be violated if
previous episodes of star formation, for instance inside the
progenitors of the assembling galaxy, enriched the gas with
metals. Even a modest enrichment to critical metallicities
as low as Zcrit < 10-6 - 10-3.5
Z may
imply the transition from a top-heavy IMF to a normal IMF
(Bromm et al. 2001;
Santoro & Shull 2006;
Schneider et al. 2006;
Smith & Sigurdsson
2007).
Note that even a few SN explosions
may already be sufficient to enrich low-mass ( ~ 108
M)
galaxies to metallicities Z > Zcrit
(Wise & Abel 2008;
Karlsson, Johnson &
Bromm 2008;
Greif et al. 2010;
Maio et al. 2011).
The luminosity in the He II 1640 Å line strongly depends
on both the IMF and stellar metallicity, and also on the age of the
galaxy, i.e., the time since the last major star-formation episode.
At fixed IMF, a change from low to zero metallicity implies an increase
in the He II 1640 Å line luminosity by about three orders of magnitude
for the first few million years after the starburst.
This reflects the exceptionally hot atmospheres of zero-metallicity
stars that render them into strong emitters of He II ionizing radiation
(Tumlinson & Shull
2000;
Bromm, Kudritzki & Loeb
2001;
Schaerer 2003).
For a top-heavy IMF, as advocated for primordial or
very low-metallicity stars,
the line luminosity is increased by another order of magnitude (see
Figure 12).
The large differences in luminosities
offer the prospect of distinguishing observationally between stellar
populations consisting of metal-free or metal-enriched stars, and of
constraining their IMFs
(Tumlinson & Shull
2000;
Bromm, Kudritzki & Loeb
2001;
Oh 2001;
Johnson et al. 2009).
JWST has
the potential to constrain the properties of starbursts in galaxies
with halo masses as low as ~ 109
M, based
on the simultaneous detection/non-detection of the
H and He II 1640 Å
lines
(Pawlik, Milosavljevic &
Bromm 2011).
Indeed, only zero-metallicity starbursts with a top-heavy IMF can be
detected in both H and
He II 1640 Å , assuming exposure times
 106
s. Whether Lyman- can be
detected as well will depend on the attenuation due to
resonant scattering in the neutral IGM. Because of the greater sensitivity
of NIRSpec compared to MIRI,
Lyman- line emission
is potentially easier to detect than
H, and it
hence remains a very powerful probe of galaxy formation at redshifts
z 10,
despite the large uncertainties caused by its resonant nature.
106
s. Whether Lyman- can be
detected as well will depend on the attenuation due to
resonant scattering in the neutral IGM. Because of the greater sensitivity
of NIRSpec compared to MIRI,
Lyman- line emission
is potentially easier to detect than
H, and it
hence remains a very powerful probe of galaxy formation at redshifts
z 10,
despite the large uncertainties caused by its resonant nature.
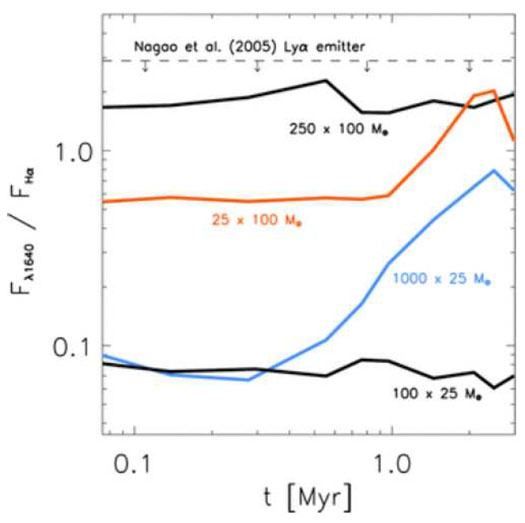 |
Figure 12. IMF diagnostics in the first
galaxies. Shown is the flux ratio in the He II 1640 Å to
H |
The second key prediction concerns the number density of the first galaxies that JWST may observe. We can estimate the number of galaxies detectable with JWST, per unit solid angle, above redshift z as follows (e.g., Pawlik, Milosavljevic & Bromm 2011):
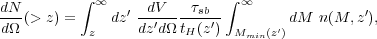 |
(7) |
where tH(z) is the age of the Universe at z, and
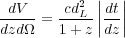 |
the comoving volume element per unit solid angle and redshift.
Here |dt / dz|-1
 (1 + z)
H0
(1 + z)
H0  m1/2
(1 + z)3/2, valid for high redshifts.
n(M, z) is the comoving
number density of galaxy host halos with mass M at redshift
z, which can
be derived from large cosmological simulations, or calculated with
approximate analytical techniques. The latter approach often relies on
variants of the Press-Schechter formalism
(Press & Schechter
1974;
for a recent review, see
Zentner 2007).
Mmin(z) is the lowest (total or virial) halo
mass capable of hosting a starburst that can be detected by the
JWST. It depends on the stellar properties (metallicity and IMF),
and on whether observations are made in, e.g., the
H line, the He II 1640
Å line, or in the soft continuum. Typical values are
Mmin ~ 108 - 109
M for
z 10 - 15
(Pawlik, Milosavljevic &
Bromm 2011).
Finally,
m1/2
(1 + z)3/2, valid for high redshifts.
n(M, z) is the comoving
number density of galaxy host halos with mass M at redshift
z, which can
be derived from large cosmological simulations, or calculated with
approximate analytical techniques. The latter approach often relies on
variants of the Press-Schechter formalism
(Press & Schechter
1974;
for a recent review, see
Zentner 2007).
Mmin(z) is the lowest (total or virial) halo
mass capable of hosting a starburst that can be detected by the
JWST. It depends on the stellar properties (metallicity and IMF),
and on whether observations are made in, e.g., the
H line, the He II 1640
Å line, or in the soft continuum. Typical values are
Mmin ~ 108 - 109
M for
z 10 - 15
(Pawlik, Milosavljevic &
Bromm 2011).
Finally,  sb gives
the duration of the starburst, which may
vary from ~ 3 Myr for top-heavy Pop III stars, to ten times larger
values for stars with normal IMF. In each case, this timescale measures
the approximate time after which negative stellar feedback terminates
the starburst. In Figure 13, we show results
from a Press-Schechter based calculation
(Pawlik, Milosavljevic &
Bromm 2011),
demonstrating that
JWST may detect a few tens (for Z > 0 and normal IMF) up to
a thousand (for Pop III with a top-heavy IMF) starbursts from z
> 10 in its field-of-view of ~ 10 arcmin2. This estimate
is consistent with previous studies for similar assumptions about the
conversion between halo and stellar mass (e.g.,
Haiman & Loeb 1997,
1998;
Oh 1999;
Trenti & Stiavelli
2008).
Current calculations, however, still suffer from
a number of uncertainties, such as whether Case B recombination theory
is appropriate in the first galaxies
(Schaerer 2003;
Raiter, Schaerer &
Fosbury 2010),
the role of dust extinction
(Trenti & Stiavelli
2006),
the feedback-regulated star formation efficiency, and the escape fraction
of ionizing radiation
(Gnedin, Kravtsov & Chen
2008;
Wise & Cen 2009;
Johnson et al. 2009;
Razoumov &
Sommer-Larsen 2010;
Yajima, Choi & Nagamine
2011).
sb gives
the duration of the starburst, which may
vary from ~ 3 Myr for top-heavy Pop III stars, to ten times larger
values for stars with normal IMF. In each case, this timescale measures
the approximate time after which negative stellar feedback terminates
the starburst. In Figure 13, we show results
from a Press-Schechter based calculation
(Pawlik, Milosavljevic &
Bromm 2011),
demonstrating that
JWST may detect a few tens (for Z > 0 and normal IMF) up to
a thousand (for Pop III with a top-heavy IMF) starbursts from z
> 10 in its field-of-view of ~ 10 arcmin2. This estimate
is consistent with previous studies for similar assumptions about the
conversion between halo and stellar mass (e.g.,
Haiman & Loeb 1997,
1998;
Oh 1999;
Trenti & Stiavelli
2008).
Current calculations, however, still suffer from
a number of uncertainties, such as whether Case B recombination theory
is appropriate in the first galaxies
(Schaerer 2003;
Raiter, Schaerer &
Fosbury 2010),
the role of dust extinction
(Trenti & Stiavelli
2006),
the feedback-regulated star formation efficiency, and the escape fraction
of ionizing radiation
(Gnedin, Kravtsov & Chen
2008;
Wise & Cen 2009;
Johnson et al. 2009;
Razoumov &
Sommer-Larsen 2010;
Yajima, Choi & Nagamine
2011).
 |
Figure 13. JWST number counts of the
first galaxies. The calculations assume texp =
106 s and S / N = 10.
Left panel: Number of galaxies N(> z) with
redshifts z > 10 hosting a starburst observable through the
detection of
H |