


The two-point correlation function has long been known to depend on galaxy properties and can vary as a function of galaxy luminosity, morphological or spectral type, color, stellar mass, and redshift. The general trend is that galaxies that are more luminous, early-type, bulge-dominated, optically red, and/or higher stellar mass are more clustered than galaxies that are less luminous, late-type, disk-dominated, optically blue, and/or lower stellar mass. Presented below are relatively recent results indicating how clustering properties depend on galaxy properties from the largest redshifts surveys currently available. The physical interpretation behind these trends is presented in Section 8 below.
Fig. 3 shows the large scale structure reflected in the galaxy distribution at low redshift. What is plotted is the spatial distribution of galaxies in a flux-limited sample, meaning that all galaxies down to a given apparent magnitude limit are included. This results in the apparent lack of galaxies or structure at higher redshift in the figure, as at large distances only the most luminous galaxies will be included in a flux-limited sample. In order to robustly determine the underlying clustering, one should, if possible, create volume-limited subsamples in which galaxies of the same luminosity can be detected at all redshifts. In this way the mean luminosity of the sample does not change with redshift and galaxies at all redshifts are weighted equally.
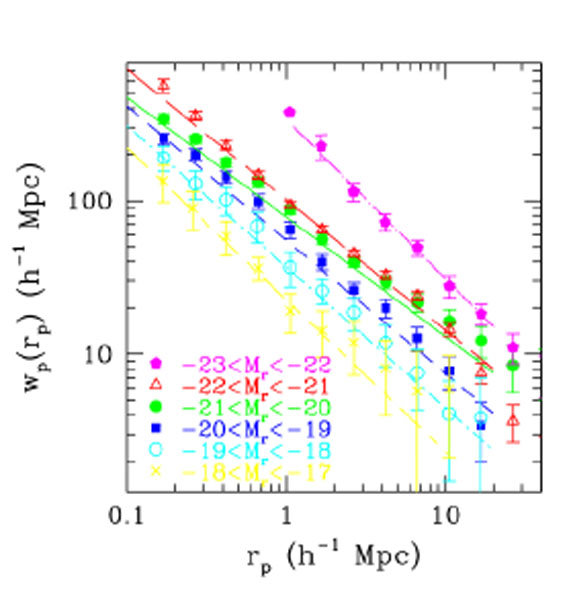
The left panel of Fig. 6 shows the projected
correlation function, wp(rp), for
galaxies in SDSS in volume-limited subsamples corresponding
to different absolute magnitude ranges. The more luminous galaxies
are more strongly clustered across a wide range in absolute optical
magnitude, from -17 < Mr < -23. Power law fits
on scales from ~ 0.1 h-1 Mpc to ~ 10
h-1 Mpc show that while the clustering
amplitude depends sensitively on luminosity, the slope does not. Only
in the brightest and faintest magnitude bins does the slope deviate
from  ~
1.8 and have a steeper value of
~ 2.0.
Across this magnitude range r0 varies from ~ 2.8
h-1 Mpc at the
faint end to ~ 10 h-1 Mpc at the bright end. This same
general trend is found in the 2dFGRS and other redshift surveys (e.g.,
Norberg et al. 2001).
~
1.8 and have a steeper value of
~ 2.0.
Across this magnitude range r0 varies from ~ 2.8
h-1 Mpc at the
faint end to ~ 10 h-1 Mpc at the bright end. This same
general trend is found in the 2dFGRS and other redshift surveys (e.g.,
Norberg et al. 2001).
The right panel of Fig. 6 shows the relative
bias of SDSS galaxies as
a function of luminosity, relative to the clustering of
L* galaxies, measured at the scale of
rp = 2.7 h-1 Mpc, which is in the
non-linear regime where  > 1
(Zehavi et al. 2005).
L* is the
characteristic galaxy luminosity, defined as the luminosity of the
break in the galaxy luminosity function. The relative bias is seen to
steadily increase at higher luminosity and rise sharply above
L*. This is in good agreement with the
results from
Tegmark et
al. (2004),
using the power spectrum of SDSS galaxies measured in the linear
regime on a scale of ~ 100 h-1 Mpc. The data also
agree with the clustering results of galaxies in the 2dFGRS from
Norberg et
al. (2001).
The overall shape of the relative bias with luminosity indicates a
slow rise up to the value at L*, above which
the rise is much steeper. As discussed in
Section 8.2 below, this trend shows that
brighter galaxies reside in more massive dark matter halos than
fainter galaxies.
> 1
(Zehavi et al. 2005).
L* is the
characteristic galaxy luminosity, defined as the luminosity of the
break in the galaxy luminosity function. The relative bias is seen to
steadily increase at higher luminosity and rise sharply above
L*. This is in good agreement with the
results from
Tegmark et
al. (2004),
using the power spectrum of SDSS galaxies measured in the linear
regime on a scale of ~ 100 h-1 Mpc. The data also
agree with the clustering results of galaxies in the 2dFGRS from
Norberg et
al. (2001).
The overall shape of the relative bias with luminosity indicates a
slow rise up to the value at L*, above which
the rise is much steeper. As discussed in
Section 8.2 below, this trend shows that
brighter galaxies reside in more massive dark matter halos than
fainter galaxies.
 |
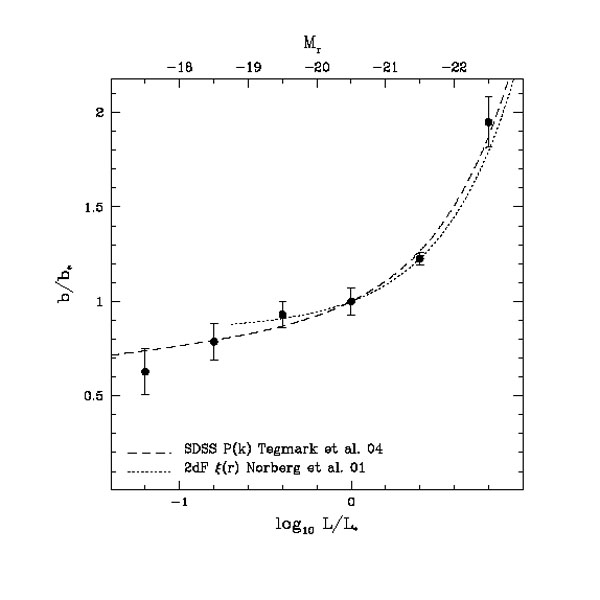 |
Figure 6. Luminosity-dependence of galaxy clustering. On the left is shown the projected correlation function, wp(rp), for SDSS galaxies in different absolute magnitude ranges, where brighter galaxies are seen to be more clustered. On the right is the relative bias of galaxies as a function of luminosity. Both figures are from Zehavi et al. (2005). |
|
6.2. Color and Spectral Type Dependence
The clustering strength of galaxies also depends on restframe color
and spectral type, with a stronger dependence than on luminosity.
Fig. 7 shows the spatial distribution of
galaxies in SDSS, color coded
as a function of restframe color. Red galaxies are seen to
preferentially populate the most overdense regions, while blue
galaxies are more smoothly distributed in space. This is reflected in
the correlation function of galaxies split by restframe color. Red
galaxies have a larger correlation length and steeper slope than blue
galaxies: r0 ~ 5-6 h-1 Mpc and
~ 2.0
for red L*
galaxies, while r0 ~ 3-4 h-1 Mpc and
~ 1.7
for blue L* galaxies in SDSS
Zehavi et al. (2005).
Clustering studies from the
2dFGRS split the galaxy sample at low redshift by spectral type into
galaxies with emission line spectra versus absorption line spectra,
corresponding to star forming and quiescent galaxies, and find similar
results: that quiescent galaxies have larger correlation lengths and
steeper clustering slopes than star forming galaxies
(Madgwick et
al. 2003).
 |
Figure 7. The spatial distribution of galaxies in the SDSS main galaxy sample as a function of redshift and right ascension, projected through 8° in declination, color coded by restframe optical color. Red galaxies are seen to be more clustered than blue galaxies and generally trace the centers of groups and clusters, while blue galaxies populate further into the galaxy voids. Taken from Zehavi et al. (2011). |
Red and blue galaxies have distinct luminosity-dependent clustering
properties. As shown in Fig. 8, the general
trends seen in r0 and
with
luminosity for all galaxies are well-reflected in the
blue galaxy population; however, at faint luminosities
(L  0.5
L*) red galaxies have larger clustering
amplitudes and slopes than
L* red galaxies. This reflects the fact that
faint red galaxies are often found distributed throughout galaxy clusters.
0.5
L*) red galaxies have larger clustering
amplitudes and slopes than
L* red galaxies. This reflects the fact that
faint red galaxies are often found distributed throughout galaxy clusters.
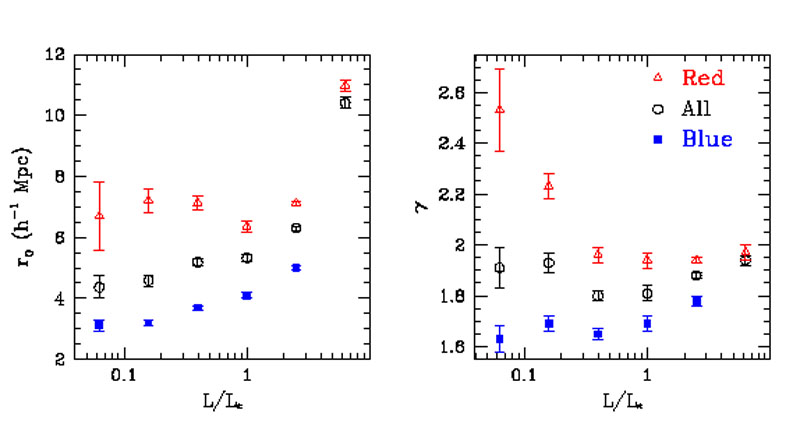 |
Figure 8. The clustering scale length,
r0 (left), and slope,
|
Galaxy clustering also depends on other galaxy properties such as stellar mass, concentration index, and the strength of the 4000Å break (D4000), in that galaxies that have larger stellar mass, more centrally concentrated light profiles, and/or larger D4000 measurements (indicating older stellar populations) are more clustered (Li et al. 2006). This is not surprising given the observed trends with luminosity and color and the known dependencies of other galaxy properties with luminosity and color. Clearly the galaxy bias is a complicated function of various galaxy properties.
6.3. Redshift Space Distortions
The fact that red galaxies are more clustered than blue galaxies is related to the morphology-density relation (Dressler 1980), which results from the fact that galaxies with elliptical morphologies are more likely to be found in regions of space with a higher local surface density of galaxies. The redshift space distortions seen for red and blue galaxies also show this.
As discussed in Section 4, redshift space
distortions arise from two
different phenomena: virialized motions of galaxies within collapsed
overdensities such as groups and clusters, and the coherent streaming
motion of galaxies onto larger structures that are still collapsing.
The former is seen on relatively small scales (rp
1
h-1 Mpc)
while the latter is detected on larger scales (rp
 1
h-1 Mpc).
While the presence of redshift space distortions complicates the
measurement of the real space
1
h-1 Mpc).
While the presence of redshift space distortions complicates the
measurement of the real space
 (r),
these distortions can be
used to uncover information about the thermal motions of galaxies in groups
and clusters as well as the amplitude of the mass density of the
Universe,
(r),
these distortions can be
used to uncover information about the thermal motions of galaxies in groups
and clusters as well as the amplitude of the mass density of the
Universe,
 matter.
Fig. 9 shows
(rp,
 )
for quiescent and star forming galaxies in 2dF.
The quiescent galaxies on the left show larger "Fingers of God" than
the star forming galaxies on the right, reflecting the fact that red,
quiescent galaxies have larger motions relative to each others. This
naturally arises if red, quiescent galaxies reside in more massive,
virialized overdensities with larger random peculiar velocities than
star forming, optically blue galaxies. The large scale coherent
infall of galaxies is seen both for blue and red galaxies, though it
is often easier to see for blue galaxies, due to their smaller
"Fingers of God".
)
for quiescent and star forming galaxies in 2dF.
The quiescent galaxies on the left show larger "Fingers of God" than
the star forming galaxies on the right, reflecting the fact that red,
quiescent galaxies have larger motions relative to each others. This
naturally arises if red, quiescent galaxies reside in more massive,
virialized overdensities with larger random peculiar velocities than
star forming, optically blue galaxies. The large scale coherent
infall of galaxies is seen both for blue and red galaxies, though it
is often easier to see for blue galaxies, due to their smaller
"Fingers of God".
 |
Figure 9. Two-dimensional redshift space
correlation function
|
These small scale redshift space distortions can be quantified using
the  12
statistic, known as the pairwise velocity dispersion
(Davis et al. 1978,
Fisher et al. 1994).
This is measured by modeling
(rp,
) in real
space, which is then convolved with a distribution of random pairwise
motions, f(v), such that
12
statistic, known as the pairwise velocity dispersion
(Davis et al. 1978,
Fisher et al. 1994).
This is measured by modeling
(rp,
) in real
space, which is then convolved with a distribution of random pairwise
motions, f(v), such that
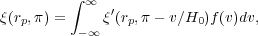 |
(23) |
where the random motions are often taken to have an exponential form, which has been found to fit observed data well:
 |
(24) |
In the 2dFGRS
Madgwick et
al. (2003)
find that 12
= 416 ± 76 km s-1 for star forming galaxies and
12 = 612
± 92 km s-1 for quiescent
galaxies, measured on scales of 8-20 h-1 Mpc. Using
SDSS data
Zehavi et al. (2002)
find that 12
is ~ 300-450 km s-1 for blue, star
forming galaxies and ~ 650-750 km s-1 for red, quiescent
galaxies. It has been shown, however, that this statistic can be
sensitive to large, rare overdensities, such that samples covering large
volumes are needed to measures it robustly.
Madgwick et
al. (2003)
further measure the large scale anisotropies seen
in (rp,
)
for galaxies split by spectral type and find that
 = 0.49
± 0.13 for star forming galaxies and
= 0.48
± 0.14 for quiescent galaxies. This implies a similar bias for both
galaxy types on large scales, though they find that on smaller scales
integrated up to 8 h-1 Mpc, the relative bias of
quiescent to star
forming galaxies is brel = 1.45 ± 0.14.
= 0.49
± 0.13 for star forming galaxies and
= 0.48
± 0.14 for quiescent galaxies. This implies a similar bias for both
galaxy types on large scales, though they find that on smaller scales
integrated up to 8 h-1 Mpc, the relative bias of
quiescent to star
forming galaxies is brel = 1.45 ± 0.14.