


Redshift surveys unveil a rich structure of galaxies, as seen in Fig. 3. In addition to measuring the two-point correlation function to quantify the clustering amplitude as a function of galaxy properties, one can also study higher-order clustering measurements as well as properties of voids and filaments.
9.1. Higher-order Clustering Measurements
Higher-order clustering statistics reflect both the growth of initial
density fluctuations as well as the details of galaxy biasing
(Bernardeau et
al. 2002),
such that measurements of higher-order clustering can test the paradigm of
structure formation through gravitational instability as well as constrain
the galaxy bias.
In the linear regime there is a degeneracy between the amplitude of
fluctuations in the dark matter density field and the galaxy bias, in
that a highly clustered galaxy population may be biased and trace only
the most overdense regions of the dark matter, or the dark matter itself
may be highly clustered. However, this degeneracy can be broken in the
non-linear regime on small scales. Over
time, the density field becomes skewed towards high density as
 becomes greater than
unity in overdense regions
(where
becomes greater than
unity in overdense regions
(where
 (
( /
/
 ) - 1 )
but can not become negative in
underdense regions. Skewness in the galaxy density distribution
can also arise from galaxy bias, if galaxies preferentially form in the
highest density peaks. One can therefore use the shapes of the galaxy
overdensities, through measurements of the three-point correlation
function, to test gravitational collapse versus galaxy bias.
) - 1 )
but can not become negative in
underdense regions. Skewness in the galaxy density distribution
can also arise from galaxy bias, if galaxies preferentially form in the
highest density peaks. One can therefore use the shapes of the galaxy
overdensities, through measurements of the three-point correlation
function, to test gravitational collapse versus galaxy bias.
To study higher-order clustering one needs large samples that cover
enormous volumes; all studies to date have focused on low redshift galaxies.
Verde et al. (2002)
use 2dFGRS to measure the Fourier transform of the three-point
correlation function, called the bispectrum, to constrain the galaxy bias
without resorting to comparisons with N-body simulations in order to
measure the clustering of dark matter.
(Fry & Gaztanaga
1993)
present the galaxy bias in terms of a Taylor expansion of the
density contrast, where the first order term is the linear term, while the
second order term is the non-linear or quadratic term.
Measured on scales of 5 - 30 h-1 Mpc,
Verde et al. (2002)
find that the linear galaxy bias is consistent with unity
(b1 = 1.04 ± 0.11),
while the non-linear quadratic bias is consistent with zero
(b2 = -0.05 ± 0.08). When combined with the
redshift space distortions measured in the two-dimensional two-point
correlation function
( (rp,
(rp,
 )), they measure
 matter =
0.27 ± 0.06 at z =
0.17. This constraint on the matter density of the Universe is derived
entirely from large scale structure data alone.
matter =
0.27 ± 0.06 at z =
0.17. This constraint on the matter density of the Universe is derived
entirely from large scale structure data alone.
Gaztañaga et
al. (2005)
measure the three-point correlation function in 2dFGRS
for triangles of galaxy configurations with different shapes.
Their results are consistent with
 CDM expectations
regarding gravitational instability of initial Gaussian
fluctuations. Furthermore, they find that while the linear bias is
consistent with unity (b1 = 0.93 +0.10/-0.08), the
quadratic bias is non-zero (b2 / b1
= -0.34 +0.11/-0.08). This implies that there is a non-gravitational
contribution to the three-point function, resulting from galaxy
formation physics. These results differ from those of
Verde et al. (2002),
which may be due to the inclusion by
Gaztañaga et
al. (2005)
of the covariance between measurements on different scales.
Gaztañaga et
al. (2005)
combine their results with the measured two-point
correlation function to derive
CDM expectations
regarding gravitational instability of initial Gaussian
fluctuations. Furthermore, they find that while the linear bias is
consistent with unity (b1 = 0.93 +0.10/-0.08), the
quadratic bias is non-zero (b2 / b1
= -0.34 +0.11/-0.08). This implies that there is a non-gravitational
contribution to the three-point function, resulting from galaxy
formation physics. These results differ from those of
Verde et al. (2002),
which may be due to the inclusion by
Gaztañaga et
al. (2005)
of the covariance between measurements on different scales.
Gaztañaga et
al. (2005)
combine their results with the measured two-point
correlation function to derive
 8 = 0.88
+0.12/-0.10.
8 = 0.88
+0.12/-0.10.
If the density field follows a Gaussian distribution, the higher-order clustering terms can be expressed solely in terms of the lower order clustering terms. This "hierarchical scaling" holds for the evolution of an initially Gaussian distribution of fluctuations under gravitational instability. Therefore departures from hierarchical scaling can result either from a non-Gaussian initial density field or from galaxy bias. Redshift space higher-order clustering measurements in 2dFGRS are performed by Baugh et al. (2004) and Croton et al. (2004a), who measure up to the six-point correlation function. They find that hierarchical scaling is obeyed on small scales, though deviations exist on larger scales (~ 10 h-1 Mpc). They show that on large scales the higher-order terms can be significantly affected by massive rare peaks such as superclusters, which populate the tail of the overdensity distribution. Croton et al. (2004a) also show that the three-point function has a weak luminosity dependence, implying that galaxy bias is not entirely linear. These results are confirmed by Nichol et al. (2006) using galaxies in the SDSS, who also measure a weak luminosity dependence in the three-point function. They find that on scales > 10 h-1 Mpc the three-point function is greatly affected by the "Sloan Great Wall", a massive supercluster that is roughly 450 Mpc (Gott et al. 2005) in length and is associated with tens of known Abell clusters. These results show that even 2dFGRS and SDSS are not large enough samples to be unaffected by the most massive, rare structures.
Several studies have examined higher-order correlation functions for galaxies split by color. Gaztañaga et al. (2005) find a strong dependence of the three-point function on color and luminosity on scales < 6 h-1 Mpc. Croton et al. (2007) measure up to the five-point correlation function in 2dFGRS for both blue and red galaxies and find that red galaxies are more clustered than blue galaxies in all of the N-point functions measured. They also find a luminosity-dependence in the hierarchical scaling amplitudes for red galaxies but not for blue galaxies. Taken together, these results explain why the full galaxy population shows only a weak correlation with luminosity.
In maps of the large scale structure of galaxies, voids stand out starkly to the eye. There appear to be vast regions of space with few, if any, L* galaxies. Voids are among the largest structures observed in the Universe, spanning typically tens of h-1 Mpc.
The statistics of voids - their sizes, distribution, and underdensities - are closely tied to cosmological parameters and the physical details of structure formation. While the two-point correlation function provides a full description of clustering for a Gaussian distribution, departures from Gaussianity can be tested with higher-order correlation statistics and voids. For example, the abundance of voids can be used to test the non-Gaussianity of primordial perturbations, which constrains models of inflation (Kamionkowski et al. 2009). Additionally, voids provide an extreme low density environment in which to study galaxy evolution. As discussed by Peebles (2001), the lack of galaxies in voids should provide a stringent test for galaxy formation models.
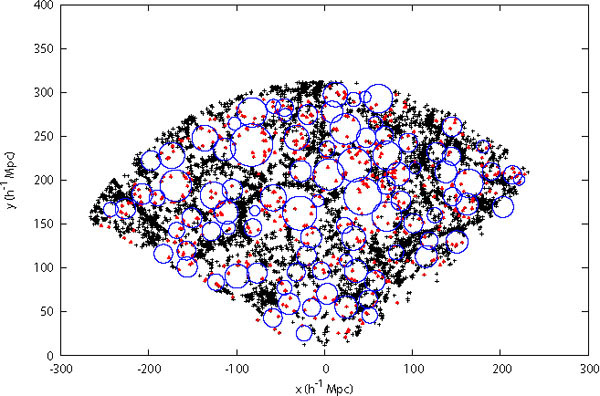 |
Figure 13. Void and wall galaxies in the SDSS. Shown is a projection of a 10 h-1 Mpc slab with wall galaxies plotted as black crosses and void galaxies plotted as red crosses. Blue circles indicate the intersection of the maximal sphere of each void with the midplane of the slab (from Pan et al. 2011). |
9.2.1. Void and Void Galaxy Properties
The first challenge in measuring the properties of voids and void galaxies is defining the physical extent of individual voids and identifying which galaxies are likely to be in voids. The "void finder" algorithm of El-Ad & Piran (1997), which is based on the point distribution of galaxies (i.e., does not perform any smoothing), is widely used. This algorithm does not assume that voids are entirely devoid of galaxies and identifies void galaxies as those with three or less neighboring galaxies within a sphere defined by the mean and standard deviation of the distance to the third nearest neighbor for all galaxies. All other galaxies are termed "wall" galaxies. An individual void is then identified as the maximal sphere that contains only void galaxies (see Fig. 10). This algorithm is widely used by both theorists and observers.
Cosmological simulations of structure formation show that the
distribution and density of galaxy voids are sensitive to the values
of matter and
(Kauffmann et
al. 1999).
Using CDM N-body
dark matter simulations,
Colberg et al. (2005)
study the properties of voids within the dark
matter distribution and predicts that voids are very underdense
(though not empty) up to a well-defined, sharp edge in the dark matter
density. They predict that 61% of the volume of space
should be filled by voids at z = 0, compared to 28% at z =
1 and 9% at z = 2. They also find that the mass function of dark
matter halos in voids is steeper than in denser regions of space.
Using similar CDM
N-body simulations with a semi-analytic model for galaxy evolution,
Benson et al. (2003)
show that voids should contain both dark matter and galaxies, and that
the dark matter halos in voids tend to be low mass and
therefore contain fewer galaxies than in higher density regions.
In particular, at density contrasts of
< -0.6, where
( / mean) - 1, both dark matter halos and
galaxies in voids should be anti-biased relative
to dark matter. However, galaxies are
predicted to be more underdense than the dark matter halos, assuming
simple physically-motivate prescriptions for galaxy evolution.
They also predict the statistical size distribution of voids, finding
that there should be more voids with smaller radii (<
10h-1 Mpc) than larger radii.
The advent of the 2dFGRS and SDSS provided the first very large
samples of voids and void galaxies that could be used to robustly
measure their statistical properties. Applying the "void finder"
algorithm on the 2dFGRS dataset,
Hoyle & Vogeley
(2004)
find that the typical radius of voids is ~ 15 h-1
Mpc. Voids are extremely underdense, with an average density of
/
= -0.94, with even lower
densities at the center, where fewer galaxies lie. The volume of
space filled by voids is ~ 40%. Probing an even larger volume of
space using the SDSS dataset,
Pan et al. (2011)
find a similar typical
void radius and conclude that ~ 60% of space is filled by voids,
which have /
= -0.85 at their edges. Voids have sharp
density profiles, in that they remain extremely underdense to the void
radius, where the galaxy density rises steeply.
These observational results agree well with the predictions of
CDM simulations
discussed above.
Studies of the properties of galaxy in voids allow an understanding of how galaxy formation and evolution progresses in the lowest density environments in the Universe, effectively pursuing the other end of the density spectrum from cluster galaxies. Void galaxies are found to be significantly bluer and fainter than wall galaxies (Rojas et al. 2004). The luminosity function of void galaxies shows a lack of bright galaxies but no difference in the measured faint end slope (Croton et al. 2005, Hoyle et al. 2005), indicating that dwarf galaxies are not likely to be more common in voids. The normalization of the luminosity function of wall galaxies is roughly an order of magnitude higher than that of void galaxies; therefore galaxies do exist in voids, just with a much lower space density. Studies of the optical spectra of void galaxies show that they have high star formation rates, low 4000Å spectral breaks indicative of young stellar populations, and low stellar masses, resulting in high specific star formation rates (Rojas et al. 2005).
However, red quiescent galaxies do exist in voids, just with a lower
space density than blue, star forming galaxies
(Croton et al. 2005).
Croton & Farrar
(2008)
show that the observed luminosity
function of void galaxies can be replicated with a
CDM N-body
simulation and simple semi-analytic prescriptions for galaxy
evolution. They explain the existence of red galaxies in voids as
residing in the few massive dark matter halos that exist in voids.
Their model requires some form of star formation quenching in massive
halos (>~ 1012
M ), but
no additional physics that operates
only at low density needs to be included in their model to match the
data. It is therefore the shift in the halo mass function in voids
that leads to different galaxy properties, not a change in the galaxy
evolution physics in low density environments.
), but
no additional physics that operates
only at low density needs to be included in their model to match the
data. It is therefore the shift in the halo mass function in voids
that leads to different galaxy properties, not a change in the galaxy
evolution physics in low density environments.
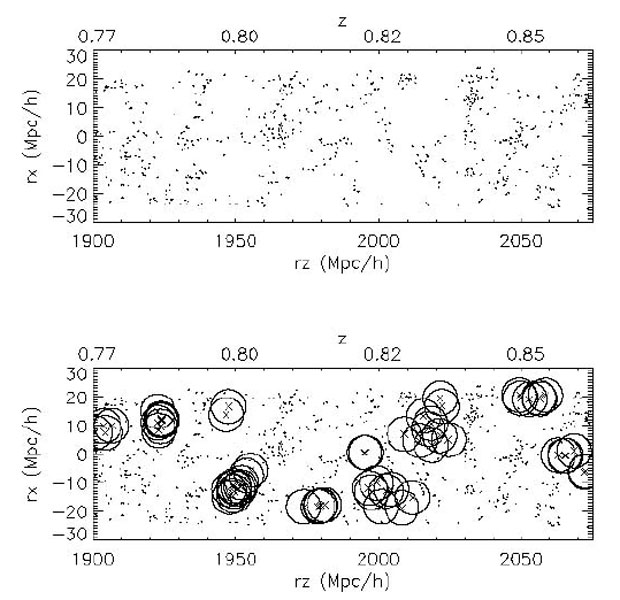 |
Figure 14. A schematic of the void probability function (VPF). The top panel shows the comoving distribution of galaxies in a small portion of the DEEP2 survey (projected through 10 h-1 Mpc), while the lower panel shows a fraction of the empty spheres identified with a radius of 6 h-1 Mpc in the same volume (from Conroy et al. 2005). Because the figure is projected through one dimension, it may appear that galaxies reside inside of identified voids; in three dimensions the voids contain no galaxies. |
9.2.2. Void Probability Function
In addition to identifying individual voids and the galaxies in them, one can study the statistical distribution of voids using the void probability function (VPF). Defined by White (1979), the VPF is the probability that a randomly placed sphere of radius R within a point distribution will not contain any points (i.e., galaxies, see Figure 11). The VPF is defined such that it depends on the space density of points; therefore one must be careful when comparing datasets and simulation results to ensure that the same number density is used. The VPF traces clustering in the weakly non-linear regime, not in the highly non-linear regime of galaxy groups and clusters.
Benson et al. (2003)
predict using CDM
simulations that the VPF of galaxies
should be higher than that of dark matter, that voids as traced by galaxies
are much larger than voids traced by dark matter. This results from the
bias of galaxies compared to dark matter in voids and the fact that in this
model the few dark matter halos that do exist in voids are low mass and
therefore often do not contain bright galaxies.
Croton et al. (2004b)
measure the VPF in the 2dFGRS dataset and find that it follows
hierarchical scaling laws, in that all higher-order correlation
functions can be expressed in terms of the two-point correlation
function. They find that even on scales of ~ 30 h-1
Mpc, higher-order correlations have an impact, and that the VPF of
galaxies is observed to be different than that of dark matter in
simulations.
Conroy et al. (2005)
measure the VPF in SDSS galaxies at z ~ 0.1 and DEEP2
galaxies at z ~ 1 and find that voids traced by redder and/or
brighter galaxy populations are larger than voids traced by bluer and/or
fainter galaxies. They also find that voids are larger in comoving
coordinates at z ~ 0.1 than at z ~ 1; i.e., voids grow
over time, as expected. They show that the differences observed in the
VPF as traced by different galaxy populations are entirely consistent with
differences observed in the two-point correlation
function and space density of these galaxy populations. This implies that
there does not appear to be additional higher-order information in voids
than in the two-point function alone. They also find excellent agreement
with predictions from
CDM simulations
that include semi-analytic models of galaxy evolution.
Tinker et al. (2008)
interpret the observed VPF in galaxy surveys in terms of
the halo model (see Section 8 above).
They compare the observed VPF in 2dFGRS and SDSS to halo model predictions
constrained to match the two-point correlation function and number density
of galaxies, using a model in which the dark matter halo occupation
depends on mass only. They find that with this model they can match the
observed data very well, implying that there is no need for the
suppression of galaxy formation in voids; i.e., galaxy formation does not
proceed differently in low-density regions. They find that the sizes
and emptiness of voids show excellent agreement with predictions of
CDM models for
galaxies at low redshift to luminosities of
L ~ 0.2 L*.
Galaxy filaments - long strings of galaxies - are the largest systems seen in maps of large scale structure, and as such provide a key test of theories of structure formation. Measuring the typical and maximal length of filaments, as well as their thickness and average density, therefore constrains theoretical models. Various statistical methods have been proposed to identify and characterize the morphologies and properties of filaments (e.g. Sousbie et al. 2008 and references therein).
In terms of their sizes, the largest length scale at which filaments are
statistically significant, and hence identified as real objects, is
50-80 h-1 Mpc, according to an analysis of galaxies in
the Las Campanas Redshift Survey (LCRS;
Shectman et
al. 1996)
by
Bharadwaj et
al. (2004).
They show that while there appear to be filaments in the survey on
longer scales, these arise from chance alignments and projection
effects and are not real structures.
Sousbie et al. (2008)
identify and study the length of filaments in SDSS, by
identifying ridges in the galaxy distribution using the Hessian matrix
(∂2
/
∂ xi
∂ xj) and its eigenvalues (see
Fig. 12).
They find excellent agreement between observations and
CDM numerical
predictions for a flat, low
matter
Universe. They argue that filament
measurements are not highly sensitive to observational effects such as
redshift space distortions, edge effects, incompleteness or galaxy bias,
which makes them a robust test of theoretical models.
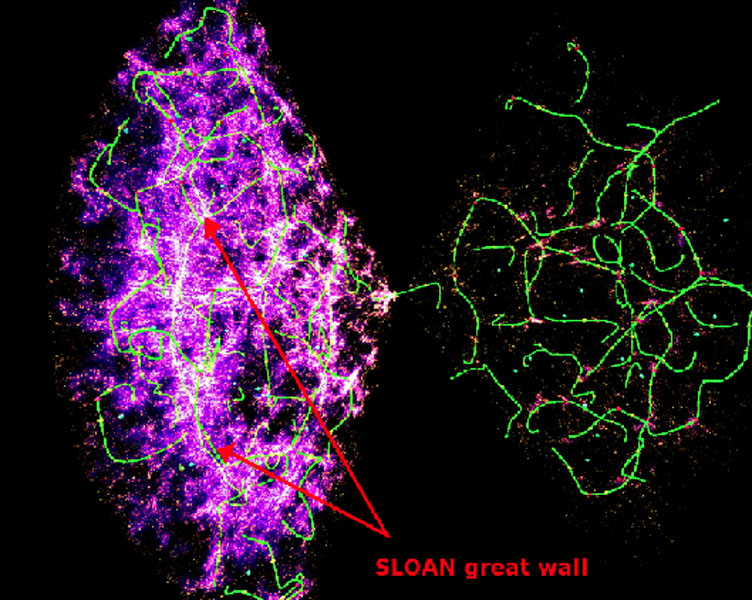 |
Figure 15. Filaments identified in the SDSS galaxy distribution (from Sousbie et al. 2008). Individual filaments are shown in green overlaid on the galaxy density field show in purple. The Sloan Great Wall is identified in the foreground, lying between the red arrows. |
Bond et al. (2010)
use the eigenvectors of the Hessian matrix of the smoothed
galaxy distribution to identify filaments in both SDSS data and
CDM simulations
and find that the distribution of filaments
lengths is roughly exponential, with many more filaments of length
 10
h-1 Mpc than > 20 h-1 Mpc. They
find that the filament width distribution agrees between
the SDSS data and N-body simulations. The mean filament width depends on
the smoothing length; for smoothing scales of 10 and
h-1 Mpc, the mean filament widths are 5.5 and 8.4
h-1 Mpc. In
CDM simulations
they find that the filamentary structure in the dark matter density
distribution is in place by z = 3, tracing a similar pattern of
density ridges. This is in contrast to what is found for voids, which
become much more prominent and low-density at later cosmic epochs.
10
h-1 Mpc than > 20 h-1 Mpc. They
find that the filament width distribution agrees between
the SDSS data and N-body simulations. The mean filament width depends on
the smoothing length; for smoothing scales of 10 and
h-1 Mpc, the mean filament widths are 5.5 and 8.4
h-1 Mpc. In
CDM simulations
they find that the filamentary structure in the dark matter density
distribution is in place by z = 3, tracing a similar pattern of
density ridges. This is in contrast to what is found for voids, which
become much more prominent and low-density at later cosmic epochs.
Choi et al. (2010)
use the methods of
Bond et al. (2010)
to study the evolution of filamentary structure from z ~ 0.8 to
z ~ 0.1 using galaxies from the DEEP2 survey and the SDSS.
They find that neither the space density of filaments nor the
distribution of filament lengths has changed
significantly over the last seven Gyr of cosmic time, in agreement
with CDM numerical
predictions. The distribution of filament
widths has changed, however, in that the distribution is broader at lower
redshift and has a smaller typical width. This observed evolution in
the filament width distribution naturally results
from non-linear growth of structure and is consistent with the results
on voids discussed above, in that over time voids grow larger while
filaments become tighter (i.e. have a smaller typical width) though not
necessarily longer.