


Surveys are our main path towards a systematic exploration of the sky. They often follow an introduction of some new technology that allows us to observe the sky in some new way, e.g., in a previously unexplored wavelength regime, or to do so more efficiently, or more quickly. It is worth examining this process in a general sense. The discussion below follows in part the ideas first discussed by Harwit (1975); see also Harwit (2003). Harwit pointed out that fundamentally new discoveries are often made by opening of the new portions of the observable parameter space, and the key role of technology in enabling such advances. An interesting, complementary discussion was provided by Kurtz (1995).
Here we propose a framework for the representation of sky surveys (or, indeed, any astronomical observations), derived catalogs of measurements, and data exploration and analysis. The purpose is to have a way of quantitatively describing and comparing these large and complex data sets, and the process for their systematic exploration. We distinguish three types of data parameter spaces, for the observations, measured properties of detected sources in these observations, and physical (rather than apparent) properties of these sources.
In the context of exploration of large digital sky surveys and Virtual Observatory, some of these ideas have been proposed by Djorgovski et al. (2001a, b, c, 2002). The present treatment develops further the concept of observational or data parameter space.
Progress in astronomy has always been driven by technology. From the viewpoint of surveys, the milestone technologies include the development of astrophotography (late 1800's), Schmidt telescopes (1930's), radio electronics (1940's to the present), access to space (from 1960's onward), ubiquitous and inexpensive computing, and digital detectors in every wavelength regime, notably the CCDs (1980's to the present).
A question naturally arises, what is the next enabling technology? The same technology that gave us computers with capabilities increasing according to Moore's law, and digital detectors like the CCDs, viz. VLSI, also enabled the rise of the modern information and computation technology (ICT) in both hardware and software forms, the internet and the Web. Most of the computing now is not about number crunching and solving a lot of differential equations quickly (although of course we still do that), but it is about manipulation, processing, and searching of information, from the raw data to the high-level knowledge products. This is sometimes described as the Third (computation-intensive) and the Fourth (data-intensive) Paradigms of science, the First and the Second being the experiment and the analytical theory (Hey et al. 2009). Science progresses using all four of them.
The realm of key enabling technologies thus evolved historically from telescopes, to detectors, and now to information and computing technologies (ICT). In astronomy, the principal research environments in which this process unfolds incorporate the Virtual Observatory framework and, more broadly, Astroinformatics. These are reviewed elsewhere in these volumes. Equivalent situations exist in many other fields of science.
ICT is therefore the enabling technology behind the modern sky surveys and their scientific exploitation. Moore's law underlies both the exponential data growth, and the new methods needed to do science with these data. Surveys are already generating or enabling a lot of good science, and will dominate the data-rich astronomy at least in the first part of the 21st century.
Every astronomical observation, surveys included, covers some finite portion of the Observable Parameter Space (OPS), whose axes correspond to the observable quantities, e.g., flux wavelength, sky coverage, etc. (see below). Every astronomical observation or a set thereof, surveys included, subtends a multi-dimensional volume (hypervolume) in this multi-dimensional parameter space.
The OPS can be divided for convenience into four domains, roughly corresponding to the type of observations, although each of the four domains is really a limited projection of the OPS:
 (or the photon
energy), flux
F (that
may be integrated over some finite bandpass), the spectroscopic
resolution R = /
(or the photon
energy), flux
F (that
may be integrated over some finite bandpass), the spectroscopic
resolution R = /
 , the inverse flux
precision F /
F(so that the
higher is better), and a polarization
sub-domain that could consist, e.g., of the inverse precision of the
measurements of Stokes parameters. One could divide it into
spectroscopic and photometric sub-domains, but photometry can be seen as
an extremely low resolution spectroscopy, and as the bandpasses shrink,
the distinctions blur.
, the inverse flux
precision F /
F(so that the
higher is better), and a polarization
sub-domain that could consist, e.g., of the inverse precision of the
measurements of Stokes parameters. One could divide it into
spectroscopic and photometric sub-domains, but photometry can be seen as
an extremely low resolution spectroscopy, and as the bandpasses shrink,
the distinctions blur.
 . The two coordinates can be
collapsed into a net
area coverage
. The two coordinates can be
collapsed into a net
area coverage  , if
it doesn't matter where on the sky the
observations are done; in this context, we use the word "area" to mean
"solid angle", following the common, if somewhat misleading usage.
, if
it doesn't matter where on the sky the
observations are done; in this context, we use the word "area" to mean
"solid angle", following the common, if somewhat misleading usage.
 , that represents a "beam
size", and should not be
confused with the astrometric accuracy; given a sufficient S/N, it is
possible to have <<
.
, that represents a "beam
size", and should not be
confused with the astrometric accuracy; given a sufficient S/N, it is
possible to have <<
.
t, and the
number of epochs (samples)
Nexp obtained at each
t. These
reflect the cadence and determine the window function of a survey.Obviously, the four domains can share some of the axes and seldom make sense in isolation. An obvious example would be a single image: it covers a finite field of view, in some finite bandpass, with some limiting magnitude and a saturation level, and a limited angular resolution determined by the pixel size and/or the PSF. An imaging survey represents a sum of the OPS hyper-volumes of the individual images. Another example is the "cosmic haystack" of SETI searches, whose axes are the area, depth, and frequency (see, e.g., Tarter 2001).
We are also starting to add the non-electromagnetic information channels: neutrinos, gravity waves, and cosmic rays; they add their own dimensions to the general OPS.
The dimensionality of the OPS is given by the number of characteristics that can be defined for a given type of observations, although some of them may not be especially useful and could be ignored in a particular situation. For example, time domain axes make little sense for the observations taken in a single epoch. Along some axes, the coverage may be intrinsically discrete, rather than continuous. An observation can be just a single point along some axis, but have a finite extent in others. In some cases, polar coordinates may be more appropriate than the purely Cartesian ones.
Some parts of the OPS may be excluded naturally, e.g., due to quantum limits, diffraction limits, opacity and turbulence of the Earth's atmosphere or the Galactic ISM on some wavelengths, etc.; see Harwit (1975, 2003). Others are simply not accessible in practice, due to limitations of the available technology, observing time, and funding.
We can thus, in principle, measure a huge amount of information arriving from the universe, and so far we have sampled well only a relatively limited set of sub-volumes of the OPS in general, much better along some axes than others: we have fairly good coverage in the visible, NIR, and radio; more limited X-ray and FIR regimes; and very poor at higher energies still. The discrimination becomes sharper if we also consider their angular resolution, etc.
The coverage and the dimensionality of the OPS determine what can be detected or measured; it fully describes the scope and the limitations of our observations. It is in principle enormous, and as our observing technologies improve, we cover an ever greater portion of it. Selection effects due to the survey limitations are also more apparent in such a representation. Examining the coverage of the OPS can yield insights for the optimal strategies for future explorations.
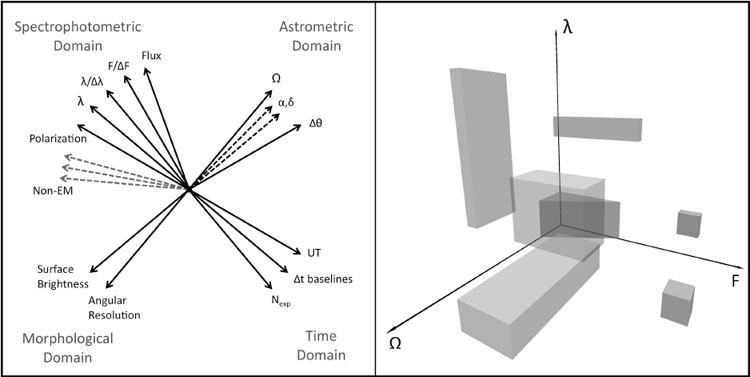 |
Figure 1. A schematic illustration of the
Observable Parameter Space (OPS). All axes of the OPS corresponding to
independent measurements are mutually orthogonal. Every astronomical
observation, surveys included, carves out a finite hypervolume in this
parameter space. Left: Principal axes of the OPS, grouped into four
domains; representing such high-dimensionality parameter spaces on a 2D
paper is difficult. Right: A schematic representation of a
particular 3D representation of the OPS. Each survey covers some solid
angle ( |
Alternatively, knowing how given types of objects populate the OPS, one
can optimize the coverage strategy to find them; for example,
Supernovae, or brown dwarfs. We note that the inverse of the area
coverage represents a limiting source density: if a survey covers the
area , in order to
detect N sources of a given species,
their surface density on the sky must be greater than N /
. For example, down
to r < 20 mag, the surface density
of quasars at redshifts z > 4 is ~ 4.1 × 10⁻²
deg 2; thus, in a survey with such limiting magnitude, in
order to find ~ 100 such objects for subsequent studies, one has to
cover at least ~ 2,500 deg2.
Two relatively poorly explored domains of the OPS may be especially interesting: the low surface brightness universe, and the time domain, at any wavelength (Djorgovski et al. 2001a, b, Brunner et al. 2001b, Diercks 2001). For example, the subject of possible missing large populations of low surface brightness galaxies has been debated extensively in the literature (see, e.g., Impey & Bothun 1997), but a systematic exploration of the low surface brightness universe is just starting. The time domain is currently undergoing a vigorous development, thanks to the advent of the modern synoptic sky surveys (Paczynski 2000, Djorgovski et al. 2012, and the volume edited by Griffin et al. 2012); we review some of them below.
As catalogs of sources and their measured properties are derived from imaging surveys, they can be represented as points (or vectors) in the Measurement Parameter Space (MPS). Every measured quantity for the individual sources has a corresponding axis in the MPS. Some could be derived from the primary measured quantities; for example, if the data are obtained in multiple bandpasses, we can form axes of flux ratios or colors; a difference of magnitudes in different apertures forms a concentration index; surface brightness profiles of individual objects can be constructed and parametrized, e.g., with the Sersic index; and so on. Some parameters may not even be representable as numbers, but rather as labels; for example, morphological types of galaxies, or a star vs. a galaxy classification.
While OPS represents the scope and the limitations of observations, MPS is populated by the detected sources and their measured properties. It describes completely the content of catalogs derived from the surveys.
Some of the axes of the OPS also pertain to the MPS; for example, fluxes or magnitudes. In those cases, one can map objects back to the appropriate projections of the OPS. However, although there is only one flux axis in a given photometric bandpass in the OPS, there may be several corresponding derived axes in the MPS, e.g., magnitudes measured in different apertures (obviously, such sets of measurement axes are correlated, and would not be mutually orthogonal). Some axes of the OPS would not have meaningful counterparts in the MPS; for example, the overall area coverage. There may also be axes of the MPS that are produced by measurements of images that are meaningless in the OPS, for example parameters describing the morphology of objects, like concentration indices, ellipticities, etc. For all of these reasons, it makes sense to separate the OPS from the MPS.
Each detected source is then fully represented as a feature vector in the MPS ("features" is a commonly used computer-science term for what we call measured parameters here). Modern imaging surveys may measure hundreds of parameters for each object, with a corresponding dimensionality of the MPS; however, many axes can be highly correlated (e.g., magnitudes in a series of apertures). It is thus a good idea to reduce the dimensionality of the MPS to a minimum set of independent axes, before proceeding to further data analysis.
The MPS in itself can be a useful research tool. For example, morphological classification of objects (stars vs. galaxies, galaxies of different types, etc.), as well as a detection and removal of measurement artifacts, which often appear as outliers from the bulk of the measurements, can be accomplished very effectively in the MPS. Sometimes, a judiciously chosen subset of parameters can be used for such tasks. Statistical and Machine Learning tools like the Kohonen Self-Organizing Maps (SOM; Kohonen 1989) can be used to find the most discriminating parameters for a given problem.
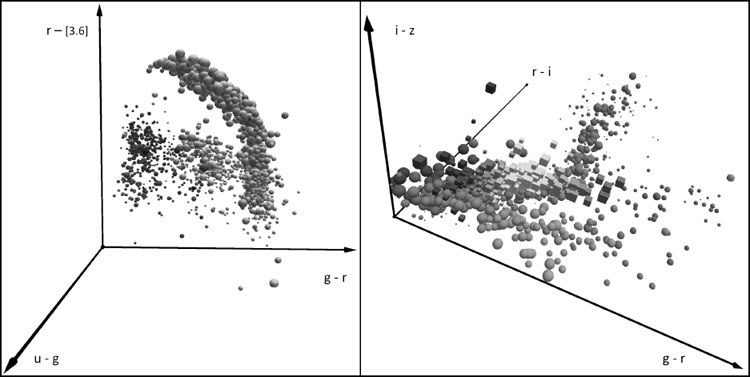 |
Figure 2.Examples of 3D projections of the Measurement Parameter Space (MPS), specifically colors. Only a couple of thousand of objects are plotted, for clarity. Left: Colors of quasars in the SDSS u'g'r' and the Spitzer 3.6 µm band, from Richards et al. (2009). Right: Colors of stars, quasars and galaxies in the SDSS u'g'r'i'z' color space. Objects of different types or sub-types form clusters and sequences in the MPS, that may be apparent in some of its projections, but not in others. In these examples, distributions in the space of observable parameters also carry a physical meaning, and can be used to separate the classes, or to search for rare types of objects, e.g., high-redshift quasars. Thus, visual inspection and exploration of data represented in the MPS can lead directly to new insights and discoveries. In addition to the 3 spatial axes, one can also use the sizes, shapes, and colors of the data points in order to encode additional dimensions. A more rigorous approach would be to use various data mining techniques, such as the clustering, classification, anomaly or outlier searches, correlation searches, and similar tasks. |
Observed properties of detected sources can then be translated through the process of data reductions and analysis into their physical properties, usually requiring some additional or interpretative knowledge, e.g., distances, and/or assuming some data model. These form the physical parameter space (PPS), where typically the scientific discoveries are made. The MPS describes observations of individual sources found in a catalog; the PPS is populated by astronomical objects, again quantified as feature vectors. For example, an observed colormagnitude diagram for stars in some field is a 2-dimensional projection of the MPS; the corresponding temperature-luminosity diagram is a projection of the PPS. A magnitude belongs to the MPS; a luminosity is a feature of the PPS. There is of course no reason to stop at 2 dimensions, and in principle, the PPS can have at least as many axes as the MPS from which it is derived, although often many can be deliberately ignored in a given analysis. Also, the PPS can have additional axes of derived parameters, e.g., masses, chemical abundances (derived from the observed equivalent widths in the MPS), and so on.
The MPS and the PPS may partly overlap, typically with the axes that represent distance-independent quantities, for example colors or some other measures of the spectral energy distributions, such as the spectral indices, or hardness ratios; surface brightness; and measures of source morphology, e.g., concentration indices; or various measures of the variability, e.g., periods, if any, decay times, etc. (In a cosmological context, relativistic corrections have to be applied to the surface brightness and any time intervals.)
Surfaces delimiting the hyper-volumes covered by surveys in the OPS map into the selection effects in the MPS and its projections to lower dimensionality parameter spaces. These, in turn, map directly into the selection effects in the PPS. The combination of these parameter spaces thus represents a quantitative framework for data analysis and exploration.
3.3. Exploring the Parameter Spaces
An early vision of such a systematic exploration of the observable universe was promoted by Zwicky (1957), who was as usual far ahead of his time, dubbing it the "Morphological Box Approach". That was perhaps an unfortunate wording; reading Zwicky's writings, it is clear that what he meant is very much like the OPS and PPS defined above. Zwicky was convinced that a systematic, orderly exploration of these parameter spaces may lead to the discoveries of previously unknown phenomena. While Zwicky was limited by the observational technology available to him at the time, today we can bring these ideas to fruition, thanks to the thorough and systematic coverage of the sky in so many different ways by sky surveys.
Astronomical objects and phenomena are characterized by a variety of physical parameters, e.g., luminosities, spectral energy distributions, morphologies, or variability patterns. Sometimes, correlations among them exist, and their interpretation leads to a deeper physical understanding. Objects of different kinds, e.g., stars, quasars, galaxies of different kinds, etc., form clusters in the PPS, reflecting their physical distinctions, and that in itself represents some knowledge and understanding. Conversely, identifying such clusters (or outliers form them) in the space of physical properties can lead to discoveries of new types or sub-types of objects or phenomena.
It is important to note that the finite, specific hypervolumes of the OPS in any given survey are effectively "window functions" that determine what can be discovered: if a particular type of objects or phenomena avoids the probed region, then none will be found, and we don't know what we are missing in the portions of the OPS that were not covered. This argues for an OPS coverage, spread among a number of surveys, that covers as much of the accessible OPS hypervolume as possible and affordable.
The OPS and the PPS may overlap in some of the axes, and new discoveries may be made in the OPS alone, typically on the basis of the shapes of the spectral energy distributions. This generally happens when a new wavelength window opens up, e.g., some blue "stars" turned out to be a new phenomenon of nature, quasars, when they were detected as radio sources; and similar examples can be found in every other wavelength regime. The unexpectedness of such discoveries typically comes from some hidden assumptions, e.g., that all star-like objects will have a thermal emission in a certain range. When astronomical sources fail to meet our expectations, discoveries are made. Improvements in angular resolution or depth can also yield discoveries, simply by inspection. Of course, noticing something that appears new or unusual is just the first step, and follow-up observations and interpretative analysis are needed.
Sometimes we expect to find objects in some region of the parameter space. For example, most quasars (especially the high-redshift ones) and brown dwarfs are found in particular regions of the color space, on the basis of an assumed (correct) model of their spectral energy distributions. Thus, PPS approach can thus be put to a good use for a directed discovery, to form samples of known, interesting types of objects by introduction of a prior knowledge. However, it also enables discoveries that were unanticipated, and approach we may call an organized serendipity.
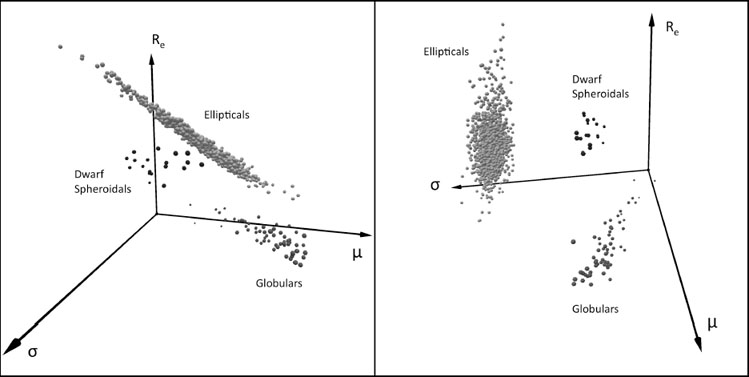 |
Figure 3. A simple illustration of a physical parameter space (PPS), viewed from two different angles. Families of dynamically hot stellar systems are shown in the parameter space whose axes are logs of effective radii, mean surface brightness, and the central velocity dispersion in the case of ellipticals, and the maximum rotational speed in the case of spirals. In the panel on the left, we see an edge-on view of the Fundamental Plane (FP) for elliptical galaxies (Djorgovski & Davis 1987). On the right we see a clear separation of different families of objects, as first noted by Kormendy (1985). They form distinct clusters, some of which represent correlations of their physical parameters that define them as families in an objective way. This galaxy parameter space (Djorgovski 1992a, b) is a powerful framework for the exploration of such correlations, and their implications for galaxy evolution. |
The PPS is not uniformly populated: astronomical objects cluster and correlate in particular regions, for good physical reasons, and are likewise absent from most of the PPS hypervolume. For example, only a few narrow, well-defined sequences are populated in the HR diagram, reflecting the physics of stellar structure and evolution. Some of these clusters correspond to the known classes of objects, but in principle other, as yet unknown clusters may exist in the unexplored corners of the PPS. Both the existence of clusters in the OPS, and the empty regions thereof in principle contain valuable information about the cosmic phenomena. Therein lies the knowledge discovery potential of this approach.
Various data mining (DM) techniques, such as supervised or unsupervised clustering analysis, outlier and anomaly searches, multivariate analysis, can be used to map out the PPS and thus the kinds of the astronomical objects that populate it (e.g., de Carvalho et al. 1995, Yoo et al. 1996). If applied in the catalog domain, the data can be viewed as a set of N points or vectors in a D-dimensional parameter space, where N can be in the range of many millions or even billions, and D in the range of a few tens to many hundreds. The data may be clustered in k statistically distinct classes, that may be uncovered through the DM process. This is computationally and algorithmically a highly non-trivial problem, that is now being addressed in the Astroinformatics and related disciplines. An example of a data exploration system along these lines is Data Mining and Exploration (DAME; Brescia et al. 2010, 2012; http://dame.dsf.unina.it). A caveat is in order: most of the commonly used DM techniques implicitly or explicitly assume that the data are complete, error-free, and free of artifacts, none of which is true in reality. Thus, they cannot be applied blindly, and scientists should understand their limitations when using them.
Effective visualization techniques can go a long way towards an exploration and intuitive understanding of all of these parameter spaces. Representation of highly-dimensional parameter spaces in 3D projections (which in themselves tend to be projected to 2D surfaces, such as the paper or a screen) poses many challenges of its own, as we are biologically limited to see in 3 dimensions. Various tricks can be used to encode up to a dozen dimensions in a pseudo-3D plot, but there is no reason why the nature would limit itself to interesting or meaningful structures in a small number of dimensions.
However, not all parameters may be equally interesting or discriminating, and lowering the dimensionality of the PPS to some more appropriate, judiciously chosen subset of parameters may be necessary. This is where the scientists' skill comes into the play.
Discovery of particularly rare types of objects, whether known or unknown, can be done as a search for outliers in a judiciously chosen projection of the PPS. Such things might have been missed so far either because they are rare, or because they would require a novel combination of data or a new way of looking at the data. A thorough, large-scale, unbiased, multi-wavelength census of the universe will uncover them, if they do exist (and surely we have not yet found all there is out there). Surveys that detect large numbers of sources are the only practical way to find extremely rare ones; for example, down to the ~ 20 mag, approximately one in a million star-like objects at high Galactic latitude is actually a quasar at z > 4, and that is not even a particularly rare type of an object these days.
Sometimes new phenomena are found (or rediscovered) independently in different regions of the OPS. Whether such repeated findings imply that there is a finite (and even a relatively modest) number of fundamentally different astronomical phenomena in the universe is an interesting question (Harwit & Hildebrand 1986).
Most of the approaches described so far involve searches in some parameter or feature space, i.e., catalogs derived from survey images. However, we can also contemplate a direct exploration of sky surveys in the image (pixel) domain. Automated pattern recognition and classification tools can be used to discover sources with a particular image morphology (e.g., galaxies of a certain type). An even more interesting approach would be to employ machine learning and artificial intelligence techniques to search through panoramic images (perhaps matched from multiple wavelengths) for unusual image patterns; known example may be the gravitationally lensed arcs around rich clusters, or supernova remnants.
Finally, an unsupervised classification search for unusual patterns or signals in astronomical data represents a natural generalization of the SETI problem (Djorgovski 2000). Manifestations of ETI may be found as "anomalous" signals and patterns in some portion of the OPS that has not been well explored previously.