


The goal of the observational cosmologist is to utilize astronomical information to derive cosmological parameters. The transformation from the observables to the parameters usually involves many assumptions about the nature of the objects, as well as of the dark sector. Below we outline the physical processes involved in each probe, and the main recent results. The first two subsections concern probes of the homogeneous Universe, while the remainder consider constraints from perturbations.
In addition to statistical uncertainties we note three sources of systematic uncertainties that will apply to the cosmological parameters of interest: (i) due to the assumptions on the cosmological model and its priors (i.e., the number of assumed cosmological parameters and their allowed range); (ii) due to the uncertainty in the astrophysics of the objects (e.g., light curve fitting for supernovae or the mass-temperature relation of galaxy clusters); and (iii) due to instrumental and observational limitations (e.g., the effect of `seeing' on weak gravitational lensing measurements, or beam shape on CMB anisotropy measurements).
These systematics, the last two of which appear as `nuisance parameters', pose a challenging problem to the statistical analysis. We attempt to fit the whole Universe with 6 to 12 parameters, but we might need to include hundreds of nuisance parameters, some of them highly correlated with the cosmological parameters of interest (for example time-dependent galaxy biasing could mimic growth of mass fluctuations). Fortunately, there is some astrophysical prior knowledge on these effects, and a small number of physically-motivated free parameters would ideally be preferred in the cosmological parameter analysis.
3.1. Direct measures of the Hubble constant
In 1929, Edwin Hubble discovered the law of expansion of the Universe
by measuring distances to nearby galaxies. The slope of the relation
between the distance and recession velocity is defined to be the
Hubble constant H0. Astronomers argued for decades on the
systematic uncertainties in various methods and derived values over
the wide range 40 km s-1 Mpc-1
 H0
100 km
s-1 Mpc-1.
H0
100 km
s-1 Mpc-1.
One of the most reliable results on the Hubble constant comes from the Hubble Space Telescope Key Project [25]. This study used the empirical period-luminosity relations for Cepheid variable stars to obtain distances to 31 galaxies, and calibrated a number of secondary distance indicators—Type Ia Supernovae (SNe Ia), the Tully-Fisher relation, surface-brightness fluctuations, and Type II Supernovae—measured over distances of 400 to 600 Mpc. They estimated H0 = 72 ± 3 (statistical) ± 7 (systematic) km s-1 Mpc-1.
A recent study [26] of over 600 Cepheids in the host galaxies of eight recent SNe Ia, observed with an improved camera on board the Hubble Space Telescope, was used to calibrate the magnitude-redshift relation for 240 SNe Ia. This yielded an even more precise figure, H0 = 73.8 ± 2.4 km s-1 Mpc-1 (including both statistical and systematic errors). The major sources of uncertainty in this result are due to the heavy element abundance of the Cepheids and the distance to the fiducial nearby galaxy, the Large Magellanic Cloud, relative to which all Cepheid distances are measured.
The indirect determination of H0 by the Planck
Collaboration
[2]
found a lower value,
H0 = 67.3 ± 1.2 km s-1 Mpc-1.
As discussed in that paper, there is strong degeneracy of
H0 with other parameters, e.g.
 m and the
neutrino mass.
The tension between the H0 from Planck and the
traditional cosmic distance-ladder methods is under investigation.
m and the
neutrino mass.
The tension between the H0 from Planck and the
traditional cosmic distance-ladder methods is under investigation.
3.2. Supernovae as cosmological probes
Empirically, the peak luminosity of SNe Ia can be used as an efficient distance indicator (e.g., Ref. 21), thus allowing cosmology to be constrained via the distance-redshift relation. The favorite theoretical explanation for SNe Ia is the thermonuclear disruption of carbon-oxygen white dwarfs. Although not perfect `standard candles', it has been demonstrated that by correcting for a relation between the light curve shape, color, and the luminosity at maximum brightness, the dispersion of the measured luminosities can be greatly reduced. There are several possible systematic effects which may affect the accuracy of the use of SNe Ia as distance indicators, e.g., evolution with redshift and interstellar extinction in the host galaxy and in the Milky Way.
Two major studies, the Supernova Cosmology Project and the High-z
Supernova Search Team, found evidence for an accelerating Universe
[28],
interpreted as due to a cosmological constant
or a dark energy component. When combined with the CMB data
(which indicates flatness, i.e.,
m +
 =
1), the best-fit values were
m
≈ 0.3 and
≈ 0.7 . Most results in the literature are consistent with the
w = -1 cosmological constant case.
Taking w = -1, the SNLS3 team found, by combining their SNIa data
with baryon acoustic oscillation (BAO) and WMAP7 data,
m =
0.279-0.015+0.019 and
=
0.724-0.016+0.017,
including both statistical and systematic errors
[31].
This includes a correction for the recently-discovered relationship between
host galaxy mass and supernova absolute brightness. This agrees with
earlier results
[33,
34],
but note the somewhat higher value for
m from
Planck (see Table 1).
Future experiments will
aim to set constraints on the cosmic equation of state w(z).
=
1), the best-fit values were
m
≈ 0.3 and
≈ 0.7 . Most results in the literature are consistent with the
w = -1 cosmological constant case.
Taking w = -1, the SNLS3 team found, by combining their SNIa data
with baryon acoustic oscillation (BAO) and WMAP7 data,
m =
0.279-0.015+0.019 and
=
0.724-0.016+0.017,
including both statistical and systematic errors
[31].
This includes a correction for the recently-discovered relationship between
host galaxy mass and supernova absolute brightness. This agrees with
earlier results
[33,
34],
but note the somewhat higher value for
m from
Planck (see Table 1).
Future experiments will
aim to set constraints on the cosmic equation of state w(z).
3.3. Cosmic microwave background
The physics of the CMB is described in detail by Scott and Smoot in this volume. Before recombination, the baryons and photons are tightly coupled, and the perturbations oscillate in the potential wells generated primarily by the dark matter perturbations. After decoupling, the baryons are free to collapse into those potential wells. The CMB carries a record of conditions at the time of last scattering, often called primary anisotropies. In addition, it is affected by various processes as it propagates towards us, including the effect of a time-varying gravitational potential (the integrated Sachs-Wolfe effect), gravitational lensing, and scattering from ionized gas at low redshift.
The primary anisotropies, the integrated Sachs-Wolfe effect, and scattering from a homogeneous distribution of ionized gas, can all be calculated using linear perturbation theory. Available codes include CAMB and CLASS [10], the former widely used embedded within the analysis package CosmoMC [35]. Gravitational lensing is also calculated in these codes. Secondary effects such as inhomogeneities in the reionization process, and scattering from gravitationally-collapsed gas (the Sunyaev-Zel'dovich (SZ) effect), require more complicated, and more uncertain, calculations.
The upshot is that the detailed pattern of anisotropies depends on all of the cosmological parameters. In a typical cosmology, the anisotropy power spectrum [usually plotted as ℓ(ℓ + 1)Cℓ] features a flat plateau at large angular scales (small ℓ), followed by a series of oscillatory features at higher angular scales, the first and most prominent being at around one degree (ℓ ≃ 200). These features, known as acoustic peaks, represent the oscillations of the photon-baryon fluid around the time of decoupling. Some features can be closely related to specific parameters — for instance, the location of the first peak probes the spatial geometry, while the relative heights of the peaks probes the baryon density — but many other parameters combine to determine the overall shape.
The 2013 data release from the Planck satellite [1] has provided the most powerful results to date on the spectrum of CMB temperature anisotropies, with a precision determination of the temperature power spectrum to beyond ℓ = 2000, shown in Fig. 1. The Atacama Cosmology Telescope (ACT) and South Pole Telescope (SPT) experiments extend these results to higher angular resolution, though without full-sky coverage. The most comprehensive measurements of CMB polarization come from the WMAP satellite final (9-year) data release [3], giving the spectrum of E-polarization anisotropies and the correlation spectrum between temperature and polarization (those spectra having first been detected by DASI [36]). These are consistent with models based on the parameters we have described, and provide accurate determinations of many of those parameters [2].
 |
Figure 1. The angular power spectrum of the
CMB temperature anisotropies from
Planck, from Ref. 1. Note the x-axis switches from
logarithmic to linear at ℓ = 50. The solid line shows the
prediction from the best-fitting
|
The data provide an exquisite measurement of the location of the first
acoustic peak, determining the angular-diameter distance of the
last-scattering surface. In combination with other data this strongly
constrains the spatial geometry, in a manner consistent with spatial
flatness and excluding significantly-curved Universes. CMB data also
gives a precision measurement of the age of the Universe. It gives a
baryon density consistent with, and at higher precision than, that
coming from BBN. It affirms the need for both dark matter and dark
energy. It shows no evidence for dynamics of the dark energy, being
consistent with a pure cosmological constant (w = -1).
The density perturbations are consistent with a power-law primordial
spectrum, and there is no indication yet
of tensor perturbations. The current best-fit for the reionization
optical depth from CMB data,  =
0.091, is in line with models of how early structure
formation induces reionization.
=
0.091, is in line with models of how early structure
formation induces reionization.
Planck has also made the first all-sky map of the CMB lensing
field, which probes the entire matter distribution in the Universe; this
detection corresponds to about
25 and adds some additional
constraining power to the CMB-only data-sets. ACT previously announced
the first detection of gravitational lensing of the CMB from the
four-point correlation of temperature variations
[37].
These measurements agree with the expected effect in the standard cosmology.
and adds some additional
constraining power to the CMB-only data-sets. ACT previously announced
the first detection of gravitational lensing of the CMB from the
four-point correlation of temperature variations
[37].
These measurements agree with the expected effect in the standard cosmology.
The power spectrum of density perturbations depends on the nature of
the dark matter. Within the
CDM model, the
power spectrum shape depends primarily on the primordial power spectrum
and on the combination
m
h which determines the horizon scale at
matter-radiation equality, with a subdominant dependence on the
baryon density. The matter distribution is most easily probed by
observing the galaxy distribution, but this must be done with care as
the galaxies do not perfectly trace the dark matter distribution.
Rather, they are a `biased' tracer of the dark matter. The need to
allow for such bias is emphasized by the observation that different
types of galaxies show bias with respect to each other. In particular
scale-dependent and stochastic biasing may introduce a systematic
effect on the determination of cosmological parameters from redshift
surveys. Prior knowledge from simulations of galaxy formation or from
gravitational lensing data could help to quantify biasing.
Furthermore, the observed 3D galaxy distribution is in redshift
space, i.e., the observed redshift is the sum of the Hubble expansion
and the line-of-sight peculiar velocity, leading to linear and
non-linear dynamical effects which also depend on the cosmological
parameters. On the largest length scales, the galaxies are expected
to trace the location of the dark matter, except for a constant
multiplier b to the power spectrum, known as the linear bias
parameter. On scales smaller than 20 h-1 Mpc or so, the
clustering pattern is `squashed' in the radial direction due to
coherent infall, which depends approximately on the parameter

 m0.6 / b (on these shorter
scales, more
complicated forms of biasing are not excluded by the data). On scales
of a few h-1 Mpc, there is an effect of elongation
along the line of sight (colloquially known as the `finger of God'
effect) which depends on the galaxy velocity dispersion.
m0.6 / b (on these shorter
scales, more
complicated forms of biasing are not excluded by the data). On scales
of a few h-1 Mpc, there is an effect of elongation
along the line of sight (colloquially known as the `finger of God'
effect) which depends on the galaxy velocity dispersion.
3.4.1. Baryonic acoustic oscillations
The power spectra of the 2-degree Field (2dF) Galaxy Redshift
Survey and the Sloan Digital Sky Survey (SDSS) are well fit by a
CDM model and both
surveys showed evidence for BAOs
[38,
39].
The Baryon Oscillation Spectroscopic Survey (BOSS) of
Luminous Red Galaxies (LRGs) in the SDSS found consistency with the dark
energy equation of state w = -1 to within ± 0.06
[40].
Similar results for w were obtained by the WiggleZ survey
[41].
The BAO data from recent galaxy redshift surveys together with SN Ia data
are shown in a Hubble diagram in Figure 2.
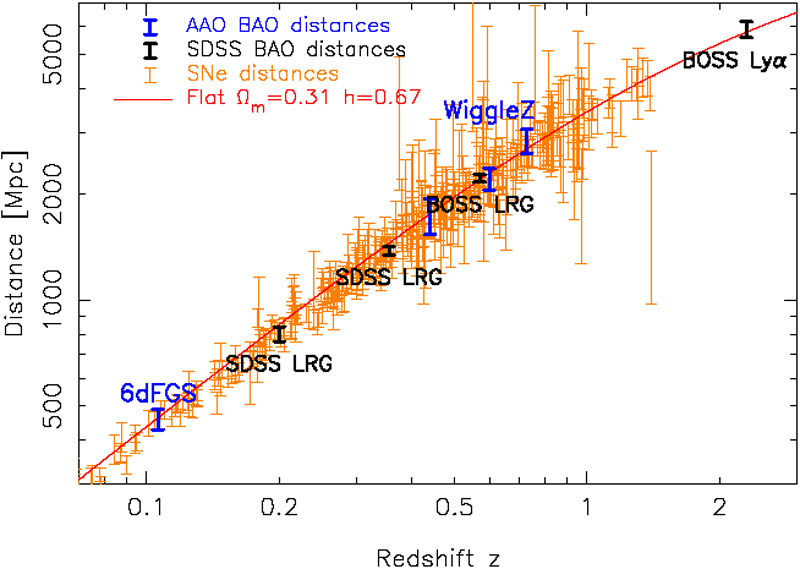 |
Figure 2. The cosmic distance scale with redshift. This modern version of the 'Hubble Diagram' combines data from SN Ia as standard candles and BAO as standard rulers in the LRG SSDS, BOSS, 6dFGRS, and WiggleZ galaxy surveys and from the BOSS Lyman-alpha at high redshift. [Figure courtesy of C. Blake, based on Ref. 33.] |
There is renewed interest in the `redshift distortion' effect. As the
measured redshift of a galaxy is the sum of its redshift due to the
Hubble expansion and its peculiar velocity, this distortion depends on
cosmological parameters
[43]
via the perturbation growth rate in linear theory
f(z) = d
lnδ / d lna ≈
 (z), where
≃ 0.55 for the
CDM model and is
different for modified gravity models. Recent observational
results show that by measuring f(z) it is feasible to
constrain
and rule out certain modified gravity models
[44,
45].
We note the degeneracy of the redshift-distortion
pattern and the geometric distortion (the so-called
Alcock-Paczynski effect), e.g. as illustrated by the WiggleZ survey
[46].
(z), where
≃ 0.55 for the
CDM model and is
different for modified gravity models. Recent observational
results show that by measuring f(z) it is feasible to
constrain
and rule out certain modified gravity models
[44,
45].
We note the degeneracy of the redshift-distortion
pattern and the geometric distortion (the so-called
Alcock-Paczynski effect), e.g. as illustrated by the WiggleZ survey
[46].
3.4.3. Integrated Sachs-Wolfe effect
The integrated Sachs-Wolfe (ISW) effect, described in the article by
Scott and Smoot, is the change in CMB photon energy when propagating
through the changing gravitational potential wells of developing
cosmic structures. In linear theory, the ISW signal is expected in
universes where there is dark energy, curvature, or modified gravity.
Correlating the large-angle CMB anisotropies with very large scale
structures, first proposed in Ref. 38, has provided results which
vary from no detection of this effect to
4 detection
[48,
49].
3.4.4. Limits on neutrino mass from galaxy surveys and other probes
Large-scale structure data constraints on
 due to the neutrino free-streaming effect
[50].
Presently there is no clear detection, and upper
limits on neutrino mass are commonly estimated by comparing the
observed galaxy power spectrum with a four-component model of baryons,
cold dark matter, a cosmological constant, and massive neutrinos.
Such analyses also assume that the primordial power spectrum is
adiabatic, scale-invariant, and Gaussian. Potential systematic
effects include biasing of the galaxy distribution and non-linearities
of the power spectrum. An upper limit can also be derived from CMB
anisotropies alone, while additional cosmological data-sets can improve
the results.
due to the neutrino free-streaming effect
[50].
Presently there is no clear detection, and upper
limits on neutrino mass are commonly estimated by comparing the
observed galaxy power spectrum with a four-component model of baryons,
cold dark matter, a cosmological constant, and massive neutrinos.
Such analyses also assume that the primordial power spectrum is
adiabatic, scale-invariant, and Gaussian. Potential systematic
effects include biasing of the galaxy distribution and non-linearities
of the power spectrum. An upper limit can also be derived from CMB
anisotropies alone, while additional cosmological data-sets can improve
the results.
Results using a photometric redshift sample of
LRGs combined with WMAP, BAO, Hubble constant and SNe Ia data
gave a 95% confidence upper limit on the total neutrino mass of 0.28eV
[51].
Recent spectroscopic redshift surveys, with more accurate redshifts but
fewer galaxies, yielded similar upper limits for assumed flat
CDM model and
additional data-sets: 0.34eV from BOSS
[52]
and 0.29eV from WiggleZ
[53].
Planck + WMAP polarization + highL CMB
[2]
give an upper limit of 0.66eV, and with additional BAO data 0.23eV.
The effective number of relativistic degrees of freedom is
Neff = 3.30 ± 0.27
in good agreement with the standard value Neff = 3.046.
While the latest cosmological data do not yet constrain the sum of
neutrino masses to below 0.2eV, as the lower limit on neutrino mass from
terrestrial experiments is 0.06eV, it looks promising that future
cosmological surveys will detect the neutrino mass.
A cluster of galaxies is a large collection of galaxies held together by their mutual gravitational attraction. The largest ones are around 1015 Solar masses, and are the largest gravitationally-collapsed structures in the Universe. Even at the present epoch they are relatively rare, with only a few percent of galaxies being in clusters. They provide various ways to study the cosmological parameters.
The first objects of a given kind form at the rare high peaks of the
density distribution, and if the primordial density perturbations are
Gaussian distributed, their number density is exponentially sensitive
to the size of the perturbations, and hence can strongly constrain
it. Clusters are an ideal application in the present Universe. They
are usually used to constrain the amplitude
8,
as a sphere of radius
8 h-1 Mpc contains about the right amount of
material to form a cluster. One of the most useful observations at present
are of X-ray emission from hot gas lying within the cluster, whose
temperature is typically a few keV, and which can be used to estimate
the mass of the cluster. A theoretical prediction for the mass
function of clusters can come either from semi-analytic arguments or
from numerical simulations.
The same approach can be adopted at high redshift (which for clusters
means redshifts of order one) to attempt to measure
8 at an
earlier epoch. The evolution of
8 is
primarily driven by the value of the matter density
m, with a
sub-dominant dependence on the dark energy properties.
The Planck observations were used to produce a sample of 189
clusters selected by the SZ effect. The cluster mass function was
constructed using a relation between the SZ signal Y and cluster
mass M. For an assumed flat
CDM model, the
Planck Collaboration found
8 = 0.77
± 0.02 and
m = 0.29
± 0.02
[54].
Somewhat larger values of both parameters are preferred by the
Planck's measurements of the
primary CMB anisotropies. The discrepancy might be resolved, for
example, by using a different Y-M calibration. For
comparison with other results in the literature see their Fig. 10.
3.6. Clustering in the inter-galactic medium
It is commonly assumed, based on hydrodynamic simulations, that the
neutral hydrogen in the inter-galactic medium (IGM) can be related to
the underlying mass distribution. It is then possible to estimate the
matter power spectrum on scales of a few megaparsecs from the
absorption observed in quasar spectra, the so-called Lyman-α
forest. The usual procedure is to measure the power spectrum of the
transmitted flux, and then to infer the mass power spectrum.
Photo-ionization heating by the ultraviolet background radiation and
adiabatic cooling by the expansion of the Universe combine to give a
simple power-law relation between the gas temperature and the baryon
density. It also follows that there is a power-law relation between
the optical depth and
 b.
Therefore, the observed flux F =
exp(-) is strongly
correlated with
b,
which itself traces the mass density. The matter
and flux power spectra can be related by
b.
Therefore, the observed flux F =
exp(-) is strongly
correlated with
b,
which itself traces the mass density. The matter
and flux power spectra can be related by
 |
(10) |
where b(k) is a bias function which is calibrated from
simulations. The BOSS survey has been used to detect and measure the BAO
feature in the Lyman-α forest fluctuation at redshift z =
2.4, with a result impressively consistent with the standard
CDM model
[55].
The Lyman-α flux power spectrum has also been used to constrain the
nature of dark matter,
for example constraining the amount of warm dark matter
[56].
Images of background galaxies are distorted by the gravitational effect of mass variations along the line of sight. Deep gravitational potential wells such as galaxy clusters generate `strong lensing', leading to arcs, arclets and multiple images, while more moderate perturbations give rise to `weak lensing'. Weak lensing is now widely used to measure the mass power spectrum in selected regions of the sky (see Ref. 48 for reviews). As the signal is weak, the image of deformed galaxy shapes (the `shear map') must be analyzed statistically to measure the power spectrum, higher moments, and cosmological parameters.
The shear measurements are mainly sensitive to a combination of
m and the
amplitude 8.
For example, the weak-lensing signal detected by the CFHTLens Survey
(over 154 sq. deg. in 5 optical bands) yields,
for a flat CDM model,
8
(m /
0.27)0.6 = 0.79 ± 0.03
[60].
Earlier results for comparison
are summarized in Ref. 48. There are various systematic effects
in the interpretation of weak lensing, e.g., due to atmospheric
distortions during observations, the redshift distribution of the
background galaxies, the intrinsic correlation of galaxy shapes, and
non-linear modeling uncertainties.
Deviations from the Hubble flow directly probe the mass perturbations
in the Universe, and hence provide a powerful probe of the dark matter
[62].
Peculiar velocities are deduced from the
difference between the redshift and the distance of a galaxy. The
observational difficulty is in accurately measuring distances to
galaxies. Even the best distance indicators (e.g., the
Tully-Fisher relation) give an uncertainty of 15% per galaxy, hence
limiting the application of the method at large distances. Peculiar
velocities are mainly sensitive to
m, not to
or
dark energy. While at present cosmological parameters derived from
peculiar velocities are strongly affected by random and systematic
errors, a new generation of surveys may improve their accuracy. Three
promising approaches are the 6dF near-infrared survey of 15,000
peculiar velocities, peculiar velocities of SNe Ia, and the
kinematic Sunyaev-Zel'dovich effect.