Copyright © 2014 by Annual Reviews. All rights reserved
| Annu. Rev. Astron. Astrophys. 2014. 52:
Copyright © 2014 by Annual Reviews. All rights reserved |


The detection of an isotropic cosmic far-infrared background (CIB) by the COBE satellite (see Hauser & Dwek 2001, Lagache, Puget & Dole 2005 for reviews) was immediately interpreted in terms of radiation from galaxies in the early universe, absorbed and re-emitted by their interstellar dust. Strong observational support was provided by retrieving the major part of the CIB when stacking Spitzer 70 and 160 μm data at the positions of mid-infrared detected galaxies (Dole et al. 2006), and by resolving the majority of its 850 μm long wavelength tail using the deepest SCUBA counts, assisted by gravitationally lensing clusters of galaxies (e.g. Knudsen, van der Werf & Kneib 2008, Zemcov et al. 2010). Closer to the peak of the CIB, source confusion restricted the smaller cryogenic far-infrared telescopes ISO and Spitzer to mostly statistical methods, a limitation that is significantly relaxed by Herschel's larger primary mirror and improved wavelength coverage.
2.1. Number counts and resolved fraction of the far-infrared background
The enhanced Herschel capabilities were rapidly used for number count studies based on different analysis techniques: Direct resolved detection, stacking analysis, and probability of deflection analysis (P(D)). At 70-160 μm, Berta et al. (2010, 2011) and Magnelli et al. (2013) provide counts of increasing depth from individually resolved detections, based on a variety of deep blank fields, and consistent with the analysis of the lensing cluster Abell 2218 by Altieri et al. (2010). Rigby et al. (2011) extend the 100 and 160 μm counts to larger area, and Sibthorpe et al. (2013) reconfirm that cosmic variance is a minor concern for these results. Stacking and P(D) analysis at these wavelengths has been reported by Berta et al. (2011) but provides only a modest extension compared to the very deep resolved PACS counts. At 250-500 μm, Oliver et al. (2010), Clements et al. (2010), and Béthermin et al. (2012b) provide resolved counts. Because of the higher SPIRE confusion limits, statistical methods are more important and have been applied by (P(D), Glenn et al. 2010) and (stacking, Béthermin et al. 2012b). At all Herschel wavelengths, measurements now reach below the knee in the integral number counts (i.e. the peak in the euclidean normalized differential number counts). An unusual feature of the bright end of the counts at long Herschel wavelengths is the significant contribution by gravitationally lensed sources (Section 4.1).
Figure 3 summarizes number count results for the central wavelengths of the two Herschel cameras, again highlighting the importance of statistical methods at the longer wavelengths because of increasing source confusion. Different measures of source confusion are in use and applicable for different shapes of the number counts and location of the detection limit in the counts (see, e.g., discussion in Dole et al. 2004). For 500, 350, and 250 μm Nguyen et al. (2010) report a confusion noise of 6.8, 6.3, and 5.8 mJy. For 160 and 100 μm confusion noise has been measured by Berta et al. (2011) and using the deepest PACS data by Magnelli et al. (2013), who find 0.68 and 0.15 mJy, respectively. No Herschel deep survey reaches the extragalactic confusion limit at 70 μm for a 3.5 m telescope (Berta et al. 2011).
 |
Figure 3. Euclidean normalized differential number counts for 100 μm (Herschel-PACS) and 350 μm (SPIRE). The references quoted in the figure also provide counts at other Herschel wavelengths. The dotted line shows an example for a number count model (Béthermin et al. 2012a). |
In addition to the star formation rates and black hole accretion rates of galaxies, direct predictions of far-infrared counts from semianalytic or hydrodynamical models of galaxy evolution are sensitive to the amount and geometry of obscuring dust. Amount of dust and in particular its poorly predictable distribution affect energy and shape of the far-infrared SED. For that reason among others, infrared counts have been traditionally interpreted in terms of backward evolution models which adopt locally calibrated empirical SEDs or families of SEDs. These models then predict counts on the basis of an assumed evolution of luminosity and number densities of the luminosity functions for the populations that are represented by these SEDs. Already before the launch of Herschel (e.g., Valiante et al. 2009), assumptions on evolution of SEDs at given infrared luminosity started to be included as well. As noted in many of the works presenting observed Herschel counts, pre-Herschel models often gave decent representations of the observed counts in some individual bands, but typically did less well in providing a consistent picture for all available far-infrared bands, and in particular for the redshift distributions. It is inevitable that future more successful models include the Herschel evidence on evolution of SEDs (see Section 3), as already attempted in the model of Béthermin et al. (2012a) which implements SEDs for galaxies on the evolving main sequence of star forming galaxies and for starbursts above this sequence. The same constraints on adopted SEDs as for the simple backward models will be faced by the more physical forward semianalytic or hydrodynamical models.
Figure 4 summarizes the 70-850 μm cosmic far-infrared background as directly measured by COBE, and the contributions of galaxies as determined by Spitzer, Herschel, and groundbased submillimeter surveys. The extrapolation of measured number counts is consistent with the direct CIB measurements, and provides smaller uncertainties at some wavelengths near the peak of the CIB. Combining extrapolated Spitzer, Herschel, and 850 μm results, the total 8-1000 μm background is 27-3+7 nW m-2 sr-1 (Béthermin et al. 2012b). There is no evidence for a diffuse extragalactic IR background that is not accounted for by galaxies. The CIB fraction accounted for by individually resolved galaxies peaks at 75% at 100 and 160 μm (Magnelli et al. 2013). The resolved fraction is lower at 70 μm where Herschel could not integrate to its confusion limit (Berta et al. 2011), and at 250-500 μm with 15-6% of the CIB resolved at these wavelengths due to increasing source confusion (Oliver et al. 2010, Béthermin et al. 2012b). At 250-500 μm, stacking analysis again attributes 73 to 59% of the CIB to known galaxies (Béthermin et al. 2012b). As expected, the typical redshift of sources contributing to the CIB increases with wavelength (lower panel of Figure 4). Of the major CIB fraction that is directly resolved or retrieved by stacking, half of the emission at wavelengths 100, 160, 250, 350, and 500 μm is contributed by sources above z = 0.75, 1.00, 1.04, 1.20, and 1.25 (Magnelli et al. 2013, Béthermin et al. 2012b). Median redshifts of sources with fluxes above faint limits are naturally somewhat higher (e.g. zMed = 1.37 above S100 = 1.5 mJy, zMed = 1.22 above S160 = 2.5 mJy).
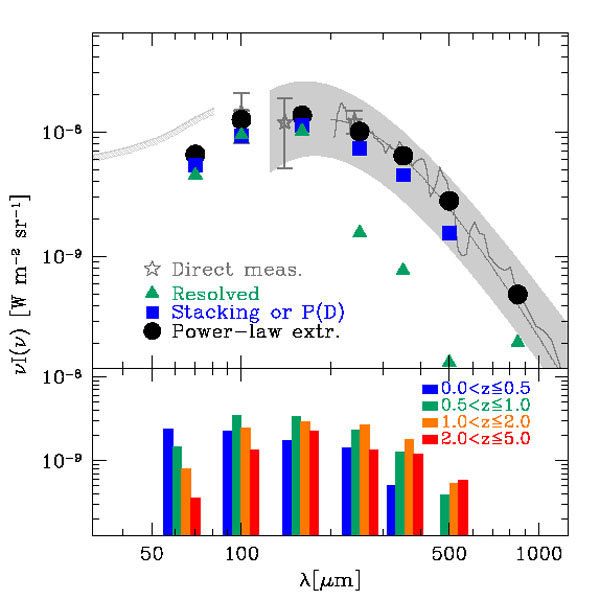 |
Figure 4. The cosmic far-infrared background as seen by direct measurements and as resolved by Herschel. Direct measurements (grey) include the γ-ray based limits of Mazin & Raue (2007), COBE-DIRBE results as presented in Dole et al. (2006) (asterisks), the COBE-FIRAS λ > 200 μm spectrum of Lagache et al. (1999) and the modified blackbody fit of Fixsen et al. (1998). CIB contributions by resolved sources are from Berta et al. (2011) and Magnelli et al. (2013) (70-160 μm), Béthermin et al. (2012b) (200-500 μm) and Zemcov et al. (2010) (850 μm). Stacking results are from Béthermin et al. (2010) (70 μm) Berta et al. (2011) (100, 160 μm) and Béthermin et al. (2012b) (250-500 μm), power law count extrapolations from the same works and Zemcov et al. (2010) (850 μm). The lower panel shows the contributions of different redshift slices to the part of the CIB that is contained in resolved sources (PACS) and covered by stacking (SPIRE) (Berta et al. 2011, Magnelli et al. 2013, Béthermin et al. 2012b). |
2.2. Extinction insensitive star formation rates and comparison to other tracers
Far-infrared emission is an established tool to determine star formation rates of galaxies. The total infrared luminosity provides an observationally straightforward calorimetric measure that can be interpreted as total star formation rate (SFR), if considering a number of aspects.
First, the infrared traces only the obscured part of the radiation emitted by the ensemble of young stars in a galaxy, the part which is absorbed by dust. A short wavelength tracer has to be used to quantify the escaping fraction, in order to either ensure dominance of the obscured star formation, or revert to a composite star formation indicator that adds the obscured and unobscured star formation. In massive high-z star forming galaxies, dust obscured star formation is typically about 5-10 times stronger than unobscured star formation (Section 4.2).
Second, the contribution to the IR luminosity by accretion onto an active galactic nucleus (AGN) has to be low in order for star-formation to dominate. This is discussed in Section 5, but in short the generally elevated star formation in high redshift galaxies implies that for moderate luminosity AGN from typical surveys, host stellar heated emission will dominate over AGN heated emission in the far- and sometimes even mid-infrared. Elimination of known AGN on the basis of X-ray data and of rest frame near-infrared hot dust `power laws' can further reduce this source of uncertainty.
Third, dust can also be heated by older stars, which can dominate the dust heating in regions such as the bulges of quiescent local spirals. This makes the conversion from total infrared (8-1000 μm) luminosity to current star formation rate more dependent on the star formation history than for tracers of O stars, such as the Hα line which originates only in the ionized gas. Compared to the assumption of constant star formation over 100 Myr, as in the widely adopted conversion of Kennicutt (1998) (note update in, Kennicutt & Evans 2012), constant star formation over 10 Gyr will increase the ratio of IR luminosity and current SFR by almost a factor 2, an effect that can increase further for decaying star formation histories. Further aspects of multiwavelength methods to determine star formation rates, including updated calibrations, are covered in the recent review by Kennicutt & Evans (2012).
2.2.1. REST FRAME FAR-INFRARED STAR FORMATION RATES Deriving total 8-1000 μm IR luminosities and star formation rates by fitting SED templates is straightforward for fully sampled Herschel SEDs, but sensitivity and confusion limits often limit detections to one or two photometric bands only. Several studies confirm that, as long as one of these detected photometric points is near the far-infrared SED peak, such monochromatic based IR luminosities are good to ± 0.1-0.2 dex even if considering a wide range of possible SED shapes (Elbaz et al. 2011, Nordon et al. 2012, Berta et al. 2013b, Magnelli et al. 2013). For the fitting, SEDs derived from or validated on Herschel data should be used, since lack of observational constraints caused some earlier SED families to show too low fluxes on the long wavelength side of the far-infrared (FIR) peak (Elbaz et al. 2010).
For the high redshift star forming galaxies that are individually detected in Herschel surveys, the ratio of infrared and ultraviolet (UV) luminosity LIR / νLν(UV) (also called the infrared excess IRX) is typically of order 10, sometimes higher (e.g. Buat et al. 2010, Buat et al. 2012, Nordon et al. 2013, Section 4.2). These Herschel detections are mostly galaxies near and above the `main sequence' of star forming galaxies, the narrow locus of most star forming galaxies in the star formation rate - mass plane (e.g. Brinchmann et al. 2004, Noeske et al. 2007, Elbaz et al. 2007, Daddi et al. 2007 see also Section 3.2). Only rarely do galaxies with individual Herschel detections fall short of IRX ~ 2 (e.g., in the UV selected sample of Oteo et al. 2012b). Converting from the ratio of luminosities to SFR ratios, obscured star formation thus dominates safely and IR based SFRs are useful even without adding the unobscured UV, as is of course still recommended if ultraviolet data are available. More care in this respect is needed for lower star formation rate and lower obscuration samples for which stacked Herschel detections can still be obtained (e.g. the samples of Reddy et al. 2012, Lee et al. 2012, with IRX ~ 7 and ~ 3-4).
Comparing IR based star formation rates with the scarcer Hα star formation rates (extinction corrected using the Balmer decrement), studies find good agreement. This applies both to a sample of mostly near main-sequence star forming galaxies with Herschel and Hα detection at z ~ 0.27, SFR ~ 6 M⊙ yr-1 (Domínguez Sánchez et al. 2012), and a sample of z ~ 1.4, SFR ~ 100 M⊙ yr-1 SPIRE-selected galaxies near and above the main-sequence (Roseboom et al. 2012). The Balmer decrement suggests these samples are moderately dusty (E(B-V) ~ 0.5). These findings suggests a minor importance of dust heating by old stars in these star forming objects. Also, despite sizeable star formation rates, these galaxies cannot have a large contribution of heavily obscured star formation that is not traced by Hα. More care in interpreting the far-infrared luminosity is needed for passive objects well below the star forming sequence. Given realistic survey depths, this occurs for individual detections mostly for a subset of z < 0.5 detections, and for stacks of other passive samples.
2.2.2. STAR FORMATION RATES FROM MID-INFRARED EMISSION Given the superb Spitzer mapping speed at 24μm, mid-infrared surveys remain a key resource, including many sources that are too faint for Herschel detection. Deducing star formation rates for high-z galaxies from 24μm fluxes requires an extrapolation to LIR that is more uncertain, given the diverse factors that are shaping this spectral range: Continuum from warm or transiently heated dust in HII regions, aromatic `PAH' emission features, possibly AGN heated emission, and silicate absorption.
Traditionally, this extrapolation was done using locally calibrated luminosity dependent spectral templates (e.g. Chary & Elbaz 2001). These encode the physical properties of local infrared galaxies. Specifically, the ratio of 8μm PAH emission to total infrared is lower for local ULIRGs than for lower luminosity galaxies. This relates to the compact star forming regions and intense radiation fields of these galaxy mergers ULIRGs. Already during the Spitzer era, observations suggested that at z ~ 2 application of these templates leads to overpredicted IR luminosities (Papovich et al. 2007, Daddi et al. 2007). This `mid-IR excess' was ascribed to either relatively stronger PAH emission in z ~ 2 galaxies, or to a strong AGN mid-IR continuum.
Herschel observations have quantified this mismatch for large samples and for individual detections. There is a factor ~ 5 overprediction of z ~ 2 SFRs if using 24 μm photometry and typical locally calibrated template families (Nordon et al. 2010, Elbaz et al. 2010, Elbaz et al. 2011, Nordon et al. 2012). The effect conspicuously sets in close to z ~ 2 when the strongest PAH feature enters the MIPS 24 μm band (Elbaz et al. 2010, Elbaz et al. 2011, see also Figure 8), suggesting that it is due to enhanced PAH emission rather than due to AGN continuum. This is unambiguously confirmed (Nordon et al. 2012) by fully reproducing the photometric trends by trends in the PAH emission in the ultradeep low resolution Spitzer spectra of z ~ 1 and z ~ 2 galaxies by Fadda et al. (2010). Section 3 discusses the relation of these findings to the evolving star forming main sequence, and to changes with redshift in the interstellar medium conditions of galaxies of a given infrared luminosity.
Several procedures are in use to avoid the overprediction that arises when applying local luminosity-dependent templates to MIPS data of high-z sources. The main sequence SED template of Elbaz et al. (2011) encodes the proper 8μm/IR ratio that is valid for the bulk of MIPS galaxies except the minor fraction of starbursts above the main sequence. Similar arguments apply to the single template of Wuyts et al. (2008). Nordon et al. (2012) provide a procedure to choose the right template as a continuous function of specific star formation rate (SSFR = SFR / M∗) offset from the main sequence, while Rujopakarn et al. (2013) derive z ~ 2 relations by treating high-z galaxies as main-sequence objects, and linking their SEDs to local objects of same IR surface density. If sufficient UV to mid-IR SED information is available, it is also possible to derive IR luminosities by rescaling templates from libraries that span SED shapes without a fixed link of shape to IR luminosity. These include the library of Polletta et al. (2007) and the derivation by Berta et al. (2013b) that also considers Herschel data. Nordon et al. (2012) and Berta et al. (2013b) compare some of these revised prescriptions. Given that methods which trace the changes of SEDs with SSFR offset from the main sequence will amplify noise in the 24 μm photometry and internal spread in the SEDs at given LIR, there is a tradeoff between simple single templates (providing low scatter, but residual systematics in the comparison of LIR predicted from 24 μm data and true LIR), and the larger scatter but lower systematics in the more complex approaches.
The methods discussed above have been tested using MIPS and Herschel detections, i.e. effectively for the main sequence above ~ 1010 (1010.5) M⊙ at z ~ 1 (2), plus more actively star forming galaxies. Application to lower mass and lower SFR main sequence objects may need further validation, note that the stacked LIR / L8μm = 8.9 ± 1.3 reported by Reddy et al. (2012) for fainter UV-selected galaxies is about 80% larger than the main sequence value, possibly due to a weakening of PAH for more compact star formation and/or lower metallicity.
2.2.3. RADIO EMISSION AND THE RADIO - FAR-INFRARED CORRELATION Thirty years after its discovery, the tight correlation between the radio emission and far-infrared emission of star forming galaxies is still a challenge for models (e.g. Lacki, Thompson & Quataert 2010, Lacki & Thompson 2010 and references therein). Empirically, the radio-far-infrared correlation enables interferometric radio continuum surveys to provide a convenient high spatial resolution and extinction insensitive access to high-z star formation rates. This is true as long as no AGN related excess radio emission is present, and changes of the radio-far-infrared correlation with redshift are absent or calibrated. Supplementary radio interferometric data have hence played a key role, for example, in identifying and characterizing the submillimeter galaxy (SMG) population detected in groundbased surveys (see also Section 4.3).
Again, verification of the relation at high redshift, but with minimal extrapolation uncertainties, needs samples of star forming galaxies with SED detections near the rest frame far-infrared peak. Selection effects in both radio and far-infrared are of paramount consideration for current studies. First results using early Herschel datasets in combination with VLA surveys give no compelling evidence for an evolution of the radio-far-infrared relation out to z ~ 2 (Ivison et al. 2010, Jarvis et al. 2010) but are also consistent with modest evolution towards a lower ratio of IR to radio emission. Combining full Herschel data with upcoming JVLA radio surveys should significantly enhance the power of this approach, and guide the further use of deep radio surveys to measure star formation rates.
2.2.4. COMPARISON TO EXTINCTION CORRECTED UV EMISSION AND SED FITTING Wuyts et al. (2011a) compare star formation rates from rest-UV to near-IR SED fitting to total star formation rates that add unobscured SFRUV and re-emitted SFRIR (directly measured by Herschel or Herschel-recalibrated 24 μm), using a deep GOODS-S dataset out to z ~ 3. Star formation rates from SED fitting and total SFRs are reasonably consistent at low and intermediate star formation rates, but SED fitting underpredicts the total SFRUV+IR for galaxies with the largest ratio SFRIR / SFRUV, typically found at the highest SFRUV+IR > 100 M⊙ yr-1 and at z ≳ 2.5.
A mixed picture emerges from studies comparing Herschel far-infrared star formation rates with star formation rates estimated from UV emission and slope, via the IRX-β relation (e.g. Meurer, Heckman & Calzetti 1999). While some populations match this relation on average (Reddy et al. 2012), the scatter is large (see also Section 4.2). Specifically, the most infrared luminous galaxies often have much larger IRX than corresponding to this relation, reminiscent of the situation for local ULIRGs (Goldader et al. 2002). This offset correlates with the offset from the star forming main sequence (Nordon et al. 2013).
2.2.5. SUMMARY Given these constraints, studies of star forming galaxies over a wide range of redshifts and star formation rates may often benefit from a combined approach, which in order of decreasing star formation rate uses:
Far-infrared star formation rates for galaxies with at least one Herschel detection near the SED peak.
Mid-infrared star formation rates, using recipes that have been validated against Herschel data.
Star formation rates from rest UV to NIR SED fitting.
Specific limits between these steps, and the need to invoke all or just part of these steps will also depend on survey practicalities. Examples of studies utilizing such an approach include Wuyts et al. (2011b), Rodighiero et al. (2011), Wang et al. (2013), and Magnelli et al. (2014).
2.3. Evolution of the infrared luminosity function and the star formation rate density
Evolution of the infrared luminosity function and the infrared luminosity density encode the cosmic history of dusty star formation, and are an essential part of measuring the total cosmic star formation history. Previous determinations were mostly based on ground-based submillimeter data (requiring significant extrapolation to the total infrared emission, and covering only a small luminosity range) or Spitzer mid-infrared data (also requiring significant extrapolation to the total infrared, Section 2.2).
Early Herschel results clearly demonstrate strong evolution of the total and monochromatic infrared luminosity functions (e.g. Gruppioni et al. 2010, Vaccari et al. 2010, Dye et al. 2010, Eales et al. 2010b, Lapi et al. 2011) and, at z ~ 0, dependence on environment with the Virgo cluster showing a peaked luminosity function (Davies et al. 2010, 2012). Perhaps the most complete analyses of the evolving total infrared luminosity function are provided by Gruppioni et al. (2013) from a large combined PACS and SPIRE dataset at z ≲ 4 and by Magnelli et al. (2013) at z ≲ 2 using the deepest Herschel-PACS data. Figure 5 shows evolving total IR luminosity functions and infrared luminosity densities from these and other references. Given depth limits of the surveys used, the faint end slope of the luminosity function is only weakly constrained at all but the lowest redshifts (Figure 5), and assumptions vary. For, example at 1.0 < z < 1.2 and in the LIR < 1011.2 L⊙ range that is not constrained by Herschel, Gruppioni et al. (2013) adopt a slope of the luminosity function Φ = dN / (d(logLIR) dV) ∝ LIR-0.2 [Mpc-3 dex-1], guided by their lowest redshift bin, while Magnelli et al. (2013) adopt Φ ∝ LIR-0.6. The deepest Spitzer 24 μm data provide some guidance at these luminosities (Magnelli et al. 2013), in a regime where extrapolations from mid-infrared to total infrared are rather certain, but cannot fully resolve the ambiguities in slope. The effect of these faint end slope differences on the integrated infrared luminosity density is small, however.
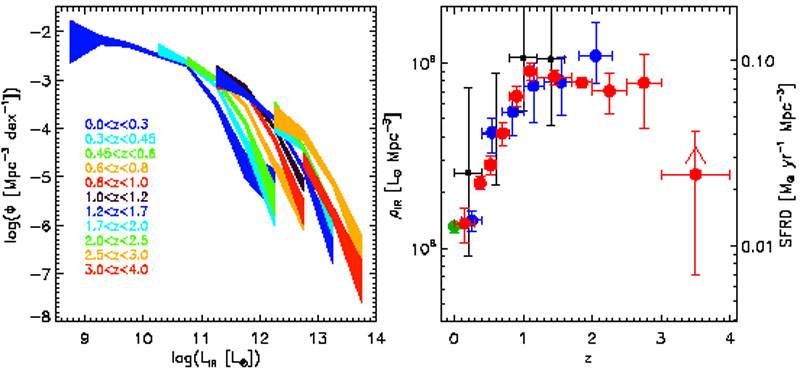 |
Figure 5. Left: Evolution of the total infrared (8-1000 μm) luminosity function. Results are from Gruppioni et al. (2013), the width of the band indicating the ± 1σ poissonian error. Right: Evolution of the infrared luminosity density. Data are from Gruppioni et al. (2013, red), Magnelli et al. (2013, blue), Casey et al. (2012, black), and the local results of Sanders et al. (2003, green). As argued by Gruppioni et al. (2013), the z ~ 3.5 point may be a mild lower limit due to selection at λ < 200 μm. Adopted cosmology and initial mass function are as in Gruppioni et al. (2013). The right axis (star formation rate density) represents only the dust-obscured part of star formation. |
In summary, infrared luminosity functions and infrared luminosity density are now determined by direct rest far-infrared measurements out to z > 3. The contribution of `LIRG' and `ULIRG' luminosity bins to the luminosity density increases from 5% and 0.4% in the local universe to 31% and 50% at z ~ 2 (Magnelli et al. 2013). This does not necessarily imply that these important z ~ 2 luminous objects physically resemble local (U)LIRGs. Most of the z = 1-2 IR luminosity density arises in near main sequence objects rather than starbursting outliers, which dominate only the upper end of the luminosity function (Gruppioni et al. 2013). Considering stellar mass bins, the IR luminosity density is dominated by the range 1010 < M[M⊙] < 1011 at all redshifts studied by Gruppioni et al. (2013).
Burgarella et al. (2013) combine the results of Gruppioni et al. (2013) with recent UV luminosity functions and compare the luminosity densities LDIR and LDUV obtained by integrating the respective luminosity functions. The ratio of infrared to UV luminosity densities traces the average obscuration of the galaxy population and is well known to rise steeply from the local universe to z ~ 1. Burgarella et al. (2013) report that the local ratio LDIR / LDUV = 4.25 ± 0.35 rises by a factor ~ 3 to reach a peak of 13.44 ± 4.68 at z ~ 1.2, and then falls again, reaching values similar to local at their last data point at z ~ 3.6, in accordance with recent evidence from rest frame UV data for decreasing obscuration of the galaxy population at high redshifts.
Since previous mid-IR based determinations of the IR luminosity function and IR luminosity density used a range of recipes to extrapolate to total IR, there is no single correction that can be applied to them. Comparisons in the references cited indicate that the new Herschel based LFs are consistent with or slightly lower than typical Spitzer based results. Several past studies reported a discrepancy between cosmic star formation history and cosmic mass assembly: The cosmic stellar mass densities inferred by integrating the star formation rate densities were a factor ~ 2 larger than those from stellar mass measurements (e.g. Hopkins & Beacom 2006, Pérez-González et al. 2008). Burgarella et al. (2013) argue that these two measurements are now in good agreement, due to a combination of the somewhat reduced Herschel based star formation rate densities, the evidence for a decreased average UV obscuration at z ≳ 1.2 which lowers UV-based SFRs at high redshift, and proper consideration in the comparison of the stellar mass that is returned to the ISM during stellar evolution (see also Behroozi, Wechsler & Conroy 2013). The total stellar mass inferred from IR/UV star-formation rates clearly depends on the assumed stellar IMF on the lower main sequence. The improved agreement between inferred and measured total stellar mass thus reduces the need to invoke bottom-light IMFs at high z (e.g., Davé 2008).
2.4. Clustering of infrared galaxies and the role of environment
Large survey areas and sample sizes, and improved systematics of current far-infrared surveys provide new opportunities to explore the clustering properties of dusty star forming galaxies and to investigate the impact of environment on their properties.
Observed and deprojected two-point correlation functions for individually detected PACS sources are presented in Magliocchetti et al. (2011, 2013), with comoving correlation lengths r0 increasing towards higher redshift and fainter sources. Sources selected at rest frame 60 μm with similar SFR ≳ 100 M⊙ yr-1 locally reside in low density environments but at z ~ 2 are found in massive Mmin ~ 1013.5 M⊙ halos. For SPIRE selected z < 0.3 samples, Guo et al. (2011) and van Kampen et al. (2012) report r0 ~ 5 Mpc similar to z < 1 PACS sources. Exploiting the gravitational magnification of background Lyman break galaxies, Hildebrandt et al. (2013) suggest that luminous S250 > 15 mJy SPIRE sources reside in massive log10(M) = 13.2 halos, in broad agreement with the z > 1 PACS sources and z = 1-3 submillimeter galaxies (Hickox et al. 2012).
Given significant confusion limits but large area high quality datasets, much of the related analysis using SPIRE as well as Planck has focussed on power spectrum analyses of the CIB fluctuations (e.g., Amblard et al. 2011, Planck Collaboration et al. 2011, Thacker et al. 2013, Planck Collaboration et al. 2013b), with the currently most complete SPIRE analysis presented in 2013bViero et al. . Power spectra and cross-frequency power spectra from SPIRE are available over scales kΘ = 0.01-2 arcmin-1, clearly showing the 1-halo and 2-halo clustering terms (Figure 6).
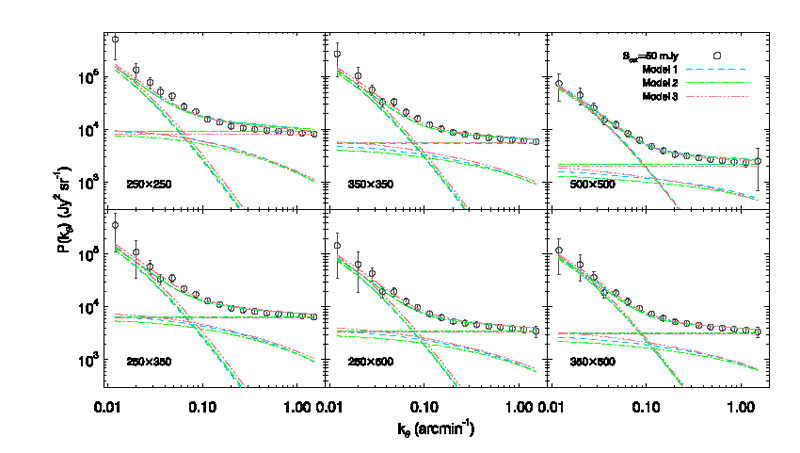 |
Figure 6. SPIRE auto- and cross frequency power spectra, with sources at fluxes greater than Scut = 50 mJy masked and cirrus subtracted. Three halo models (see Viero et al. 2013b) are fit to these power spectra as well as to the number counts of Glenn et al. (2010). Spectra are fit with three terms: Poisson (horizontal lines), 2-halo (steep lines and dominant at low KΘ) and 1-halo (less steep). Reproduced from Figure 11 of Viero et al. (2013b). |
A variety of halo and abundance matching models is under development to match these and other far-infrared data (e.g. Béthermin et al. 2013, Wang et al. 2013, Viero et al. 2013b, Planck Collaboration et al. 2013b). Results to date indicate that star formation is generally found to be dominated by M ~ 1012 M⊙ halos at all redshifts. These halos represent the progenitors of structures of larger and larger present day mass as one goes back in time. Variations still exist in the prescriptions used by the various models to match halo mass and star formation rate, as well as for the adopted or fitted infrared SEDs, and are worth further scrutiny.
It is well known that local luminous infrared galaxies preferentially reside in underdense regions rather than clusters. Herschel studies at z < 0.5 confirm this (Dariush et al. 2011, Burton et al. 2013) and suggest that the difference is mostly mediated by a change in the ratio of blue star forming to red passive galaxies, rather than by a change in the intrinsic properties of the star forming galaxies. However, Rawle et al. (2012b) present evidence for a population of unusually warm galaxies in z ~ 0.3 massive clusters, suggested to be objects where cold dust has been stripped from the galaxy's periphery. Comparing the total star formation rate per halo mass (Σ (SFR) / M) in the field, groups and clusters out to z > 1, Popesso et al. (2012) find that groups have low Σ (SFR) / M locally, but rapidly catch up with with the field Σ (SFR) / M as redshift increases. The cluster Σ (SFR) / M increases with redshift but stays below the values for field and groups out to z ~ 1. It is currently less clear to what extent these changes in the relation of SFR as traced by IR emission and environment, as well as the general rise of star forming activity with redshift, express themselves in a change (or not) of the local relation between galaxy (S)SFR and density (Popesso et al. 2011, Ziparo et al. 2014) or in the level of enhancement of IR emission in galaxy pairs compared to isolated galaxies (Hwang et al. 2011, Xu et al. 2012).
Rawle et al. (2012a) give an overview of star formation rates in brightest cluster galaxies. Use of Herschel fluxes avoids potential problems with AGN contamination that could affect previous results that are based on mid-infrared observations. The star formation rates are typically low, 1-150 M⊙ yr-1 even in the far-infrared detected subset of the sample, and comparison to Hα based SFRs suggests that star formation is little obscured in these galaxies, and likely spatially very extended. Star formation rates are clearly anti-correlated with the cooling times of the X-ray gas for cool-core clusters, but fall short of nominal X-ray based cooling rates. This is in line with mounting evidence for the importance of AGN feedback in such systems. Only in rare cases does the SFR of the brightest galaxy reach an appreciable fraction of the cooling rate that is suggested by X-ray data (McDonald et al. 2012).