


The central regions of galaxies are complex environments often displaying multiple coexisting structural components. It is thus important to define what we mean by a bulge in this context. In this chapter I will consider as a bulge the stellar structures in the central regions of galaxies that “bulge” vertically over the disk. The modern view is that there are three type of bulges: classical bulges (with properties akin to elliptical galaxies), disky bulges (with properties akin to disks), and Boxy/Peanut bulges (which are related to bars, see § 3). In addition to bulges, the central regions of galaxies can also host smaller structures such as nuclei, black holes, or nuclear rings (that do not extend vertically beyond the main disk of the galaxy).
The study of bulges is often hampered by the contamination from different sources 1. In general there are two main components that can affect our measurements: (1) the underlying main disk of the galaxy, as so far there is no indication of truncation of disks in the inner parts of galaxies; (2) dust, that will prevent the full integration along the line-of-sight and thus will only allow to measure properties of stars in front of the dust lanes. These issues are usually solved by observing galaxies in edge-on or face-on configurations. The first one will give a clear view of the bulge above the disk and avoid dust obscuration. It is most useful for prominent bulges in early-type galaxies. The face-on orientation will minimize the effects of the underlying disk. It is best for small bulges in late-type systems, which have higher surface brightness than the disk. The drawback is that if bulges are rotating, their signature will be likely minimal in that orientation.
In the following subsections I will summarize the main kinematic properties of bulges paying particular attention to those works in the literature that have considered these issues more carefully.
2.1. Rotational support and level of anisotropy
Kormendy & Illingworth (1982) were the first to describe the level of rotational support specifically in bulges of galaxies. This was achieved by measuring the maximum rotational velocity observed in the regions above the main disk where the light of the bulge dominates over the central velocity dispersion of the system (Vmax / σ). The work by Kormendy not only concluded that the level of rotation observed in galactic bulges was larger than that displayed by elliptical galaxies but also, with the aid of model predictions (Binney, 1981), concluded that bulges were very likely oblate, have isotropic velocity dispersions, and are flattened by rotation. This study was quickly followed up by Kormendy himself (Kormendy, 1982), but also other authors (Davies et al., 1983, Davies & Illingworth, 1983) reaching similar conclusions. Our current view on the level of anisotropy of bulges is, however, different (e.g. Cappellari et al., 2007).
The Vmax / σ–є diagram has been very popular for its power to classify dynamically different kind of galaxies, but most studies have focused on the study of the entire systems and not in their bulge components specifically (e.g. Bender, 1988b, Prugniel & Simien, 1994, Kormendy & Bender, 1996, Rix et al., 1999, van Zee et al., 2004). With the advent of integral field spectroscopy (IFS), this diagram has evolved and led to a parameter (i.e. λRe, Emsellem et al. (2007)) that allows a more robust (and less inclination dependent) kinematic classification of galaxies. λRe quantifies the level of specific angular momentum in a galaxy within its half-light radius. Applied to large samples of early-type galaxies it allowed the distinction between Slow and Fast rotating galaxies (Emsellem et al., 2007, Emsellem et al., 2011). Together with model predictions for oblate/prolate, (an)isotropic systems, it can also be used to establish the level of anisotropy of galaxies. This aspect was explored by Cappellari et al. (2007) for the SAURON sample (de Zeeuw et al., 2002) of early-type galaxies. This study shows that the family of Slow Rotators are weakly triaxial, while the Fast Rotators (with Vmax / σ values similar to those observed in bulges) are typically oblate and display a wide range of anisotropy values. The results of this study indicate that the anisotropy observed in Fast Rotators is mainly due to a flattening of the velocity ellipsoid in the meridional plane (σR ≥ σz), with clear indications that anisotropy is larger for intrinsically flatter galaxies. Given the significant contribution of the bulge to the light in these regions, this result suggests that bulges are actually anisotropic. This is consistent with the level of intrinsic flattening observed in different kind of bulges (see Méndez-Abreu in this volume). In this context, the study of larger samples of bulges in late-type galaxies will be very important to fully characterize their dynamical properties (e.g. CALIFA survey, Falcón-Barroso et al., 2014).
There has been very few attempts in the literature to extract a clean measurement of the anisotropy of bulges and are mostly focused on the analysis of the Milky Way bulge. The complications to decompose accurately the contributions of the disk to the velocity ellipsoid in the bulge dominated areas still remains the major hurdle. The best way forward in this topic has come from the use of detailed dynamical modelling fitting the observed stellar kinematics (e.g. Bottema et al., 1991, Pignatelli & Galletta, 1999, Kregel & van der Kruit, 2005). Nevertheless, the main limitation of those studies is that often the shape of the velocity ellipsoid is a property imposed in the fitting. The natural step forward is the use of orbit-based dynamics models (e.g. Schwarzschild, 1979) to separate the contributions of the bulge, disk, and any other components present in a galaxy and thus obtain their intrinsic properties. These models are quite demanding and require a large number of kinematic constraints. With many IFS surveys providing data for vast amounts of galaxies, it is only a matter of time that we exploit these analysis tools more routinely to study the intrinsic properties of bulges.
Many of the scaling relations used to study galaxy evolution are, in essence, different manifestations of the Virial Theorem (Clausius, 1870), and relates the kinetic energy of a galaxy with the one provided by its gravitational potential. The relationship between different structural parameters of galaxies (e.g. absolute magnitude, half-light radius, mean surface brightness), are discussed at length in other reviews in this volume. Here we concentrate only on those relations that involve the velocity dispersion of the galaxy (σ).
The Faber–Jackson relation establishes the link between the absolute magnitude of a galaxy with its central velocity dispersion (Faber & Jackson, 1976). Early-type galaxies form a well defined sequence where more luminous galaxies are also those exhibiting larger velocity dispersions. When it comes to the bulges in particular, the inclusion of bulges of lenticular galaxies hardly introduces any changes in the relation. Bulges of disk dominated spiral galaxies, however, seem to populate different regions in this parameter space, with largest offsets more from the relation defined by the ellipticals for those galaxies with latest morphological types (see Figure 2). The observed offset implies that: (1) either the bulges of later-types are brighter at a given velocity dispersion, which would suggest the presence of younger stellar populations (as they are also typically bluer) and/or (2) the dynamics of late-type bulges, at a given absolute bulge luminosity, is closer to that observed in their surrounding disks. Both cases are likely possible given that the velocity dispersion is biased towards the younger population present along the line-of-sight. Note, that despite the potential disky origin of those late-type bulges, the observed relation is not driven by the luminosity of the disk but of the bulge itself (e.g. Balcells et al., 2007).
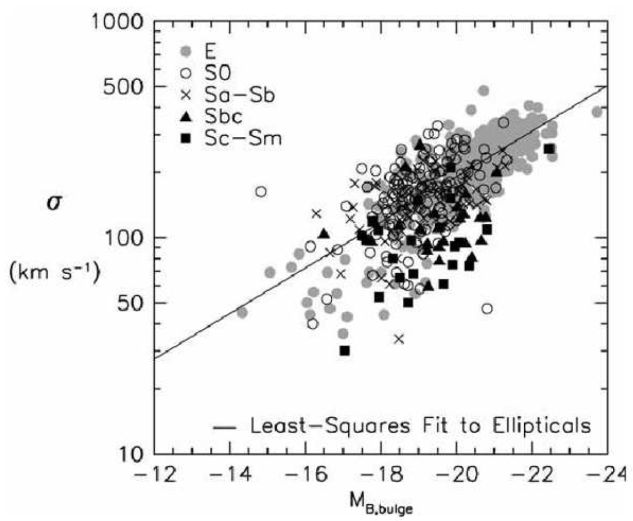 |
Figure 2. Faber-Jackson relation for galaxies of different morphological types from Kormendy & Cornell (2004). Bulges of late-type galaxies deviate systematically from the relation defined by ellipticals. |
A more direct connection with stellar populations is made in the Mg2 − σ relation (e.g. Terlevich et al., 1981). In Figure 3 we show the compilation made by Falcón-Barroso et al. (2002) using their own sample together with that of Bender et al. (1992), Jablonka et al. (1996), and Prugniel et al. (2001) against the reference relation defined for early-type galaxies by Jorgensen et al. (1996). Galaxies displaying larger amounts of ionised gas (i.e. [Oiii] equivalent width) are also the ones deviating most from the relation for early-types. This relation is usually considered as a mass–metallicity relation. This is however only true in the absence of young stellar populations. If present, the Mg2 index is no longer a good metallicity indicator and it becomes quite sensitive to age (e.g. Vazdekis et al., 2010). Galaxies with large amounts of ionised-gas are also typically the ones experiencing more intense star formation and thus result into overall younger stellar populations. It is therefore not surprising that the bulges in those galaxies are the ones deviating most from the relation described by the early-type galaxies. Similar conclusions have been reached using much larger samples (e.g. Chiappini et al., 2002), although exploring the dependence with maximum rotational velocity rather than morphological type.
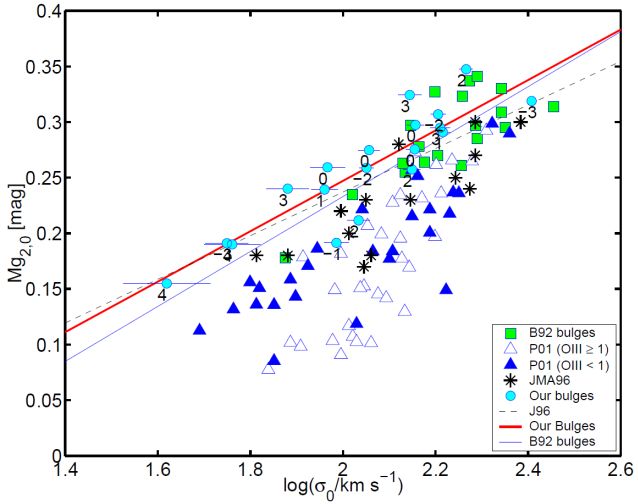 |
Figure 3. Mg2−σ relation for galactic bulges presented in Falcón-Barroso et al. (2002). The figure includes samples from this work as well as Bender et al. (1992), Jablonka et al. (1996), and Prugniel et al. (2001). Dashed line marks the reference relation for early-type galaxies observed by Jorgensen et al. (1996). Bulges of later-type galaxies, e.g. with larger amounts of ionised-gas and younger stellar populations, deviate most from the reference line. |
2.2.3. Fundamental Plane relation
The Fundamental Plane is one of the most studied scaling relations. It relates the half-light radius of galaxies to the mean surface brightness within that radius and the central velocity dispersion of the galaxy. As many other scaling relations, early-type galaxies have been studied extensively (e.g. Dressler et al., 1987, Djorgovski & Davis, 1987, Jorgensen et al., 1996, Pahre et al., 1998, Mobasher et al., 1999, Bernardi et al., 2003, D'Onofrio et al., 2008, Hyde & Bernardi, 2009, La Barbera et al., 2010, Magoulas et al., 2012, Cappellari et al., 2013). In contrast, the specific location of bulges in the relation has not been explored much and has been limited to galaxies with prominent bulges.
One of the first studies in this respect was carried out by Bender et al. (1992). They showed that bulges of lenticular galaxies followed the relation defined by elliptical galaxies. This result was later confirmed by Falcón-Barroso et al. (2002), who also found that bulges of later-type galaxies (e.g. Sbc) were slightly displaced with respect to the main relation. Bulges presenting the largest offsets were those with younger stellar populations and lower velocity dispersions. These authors showed that the offsets could be removed if one considers the missing rotational support expected in these late-type bulges. As the rotational support of some bulges increases, the measured velocity dispersion is no longer a reliable tracer of their motion. In those cases rotational velocity is a much better probe of those motions. For purely rotationally supported systems the Tully–Fisher relation (Tully & Fisher, 1977) is the one often the one invoked. Several studies have confirmed that when the full kinetic energy is accounted for and differences in the stellar populations are considered, galaxies of all morphological types form a single relation (e.g. Prugniel & Simien, 1994, Prugniel & Simien, 1996, Cappellari et al., 2006, Graves & Faber, 2010, Falcón-Barroso et al., 2011), with remaining scatter typically driven by changes in their mass-to-light ratios (e.g. Cappellari et al., 2013).
The study of the kinematic radial properties of galaxies has been one of the most prolific areas in astronomy. Mainly for bulges of early-type galaxies (e.g. Kormendy & Illingworth, 1982, Fisher, 1997, Héraudeau & Simien, 1998, Héraudeau et al., 1999, Falcón-Barroso et al., 2003, Emsellem et al., 2004, Spolaor et al., 2010), over time we quickly started to routinely explore the motions of stars in late-type systems (e.g. Bottema, 1989, Bottema, 1992, Vega Beltrán et al., 2001, Pizzella et al., 2004, Kregel & van der Kruit, 2005, Pizzella et al., 2008, Fabricius et al., 2012). More recently, we have started expanding our understanding of bulges through IFS (e.g. SAURON [Ganda et al. (2006)], DisKMass [Martinsson et al. (2013)]). While at first only rotational velocity and velocity dispersion was extracted, the arrival of new parametrizations of the line-of-sight velocity distributions (e.g. Gauss-Hermite expansions, van der Marel & Franx (1993)) allowed us to identify the presence of kinematic subcomponents in galaxies (see § 2.4 for a detailed discussion). Despite displaying clear signatures of rotational support, it is very hard to distinguish between the signal of the bulge and underlying disk in typical rotation curves. A much more fruitful avenue to explore is the study of the radial behaviour of the stellar velocity dispersion. With many bulges still having a high degree pressure support (e.g. dynamical support by random motions), it is easiest to identify the contrast between the velocity dispersion of the disk and the bulge-dominated regions.
Fisher (1997) is one of the first studies to correlate the slope of the observed velocity dispersion profile with general properties of their host galaxies (e.g. central velocity dispersion, absolute magnitude, or Mg2 and Fe line-strength indices). He analysed a sample of 18 lenticular galaxies and computed the velocity dispersion gradients along the major and minor axes of the galaxies. Compared to bright elliptical galaxies, the velocity dispersion profiles of lenticulars in his sample were much steeper. This is expected given that the profiles reached the low dispersion regimes observed in the disk dominated regions. The contrast between the velocity dispersion in the bulges and disks of his galaxies was therefore large. The intriguing result of this study was to discover that there was no correlation between these gradients and central velocity dispersion (σ0), absolute magnitude or gradients of metallicity sensitive line-strength indices. The lack of correlation with central velocity dispersion was particularly surprising, as one would expect a larger contrast (i.e. steeper gradient) between the very high central dispersion galaxies and their surrounding disk. At face value, this result suggests that: (1) the sample used in this study did not cover a sufficiently large range of central velocity dispersion values, which could be true as the lowest σ0 was above 100 km s−1 or (2) galaxies with dynamically hotter bulges (i.e. with larger σ0) have also hotter disks. At this point, with the current sample it was not possible to discern between the two scenarios.
The next natural step in this direction was to extend the sample to later-type galaxies. Falcón-Barroso et al. (2003) studied the radial kinematic profiles (along the minor axis) of 19 galaxies with morphological types expanding between S0 and Sbc. The sample was carefully chosen to have intermediate inclinations and thus permit access to the bulge with minimal contamination of the disk on one side of the galaxy. Central velocity dispersions ranged from 50 to over 300 km s−1. The analysis of their sample did show remarkably different σ radial profiles. While about half of the sample displayed very steep profiles, the remaining set showed mainly flat profiles. The lack of velocity dispersion gradient in a fair amount of galaxies in the sample was yet another piece of evidence pointing to the disky nature of some galactic bulges. In relation to the properties of the host galaxy, there was a slight tendency for galaxies with flatter profiles to display higher disk central surface brightness. A trend was also found with the ellipticity of the bulge component in the sense that more flattened bulges showed shallower gradients. Despite analysing galaxies covering a wider range of morphological types, no correlation was found with either morphological type index, bulge Sérsic index n, bulge and disk scale lengths and bulge effective surface brightness. It appears that the disky nature of bulges cannot be established on the basis of spheroid luminosity, as velocity dispersion gradients do not seem to correlate with bulge luminosity or with central velocity dispersion either.
Fabricius et al. (2012) presents the most recent effort in the literature trying to address these issues. In this work 45 S0 to Sbc galaxies were studied with the goal of relating the kinematic information with photometric properties typical of classical and pseudobulges 2. The sample contained a fair fraction of barred galaxies and displayed a wide range of central velocity dispersions (between ∼50 to 200 km s−1) and absolute magnitudes (from −18 to −21 mag). The galaxies were also moderately inclined with allowed access to the bulge region without being significantly affected by dust in the disk. Figure 4 shows the radial behaviour of the velocity dispersion along the major and minor axes of the galaxies in the sample. Similarly to Falcón-Barroso et al. (2003), bulges exhibit two types of profiles: steep and flat velocity dispersion profiles. This work provides first tentative evidence for a correlation between the slope of the velocity dispersion profile and the bulge's Sérsic index n.
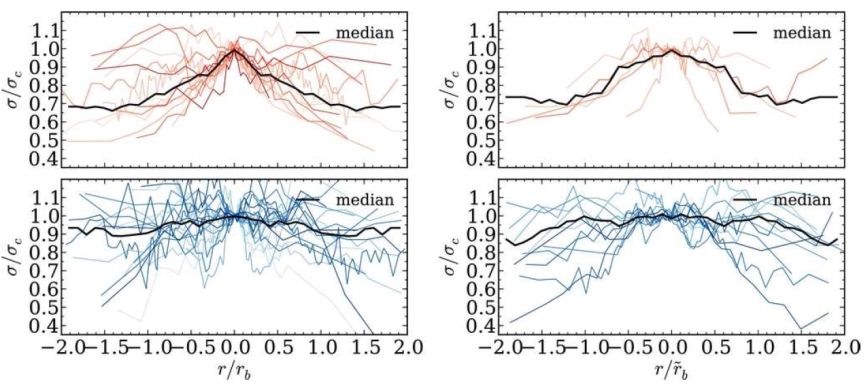 |
Figure 4. Radial velocity dispersion profiles for a sample of 45 lenticular to spiral galaxies from Fabricius et al. (2012). Profiles have been normalised to their central velocity dispersion and bulge radius. Profiles of classical bulges are plotted in red and pseudobulges in blue. Major axis profiles are shown on the left and minor axis on the right columns respectively. The thick black lines correspond to the median of the individual profiles. |
The study of the stellar kinematics of late-type galaxies has usually been hampered by complex, often dusty, morphologies. Furthermore, bulges in those galaxies are not particularly bright which makes the extraction of any spectroscopic measurement (kinematic in particular) specially harder. With the advent of integral-field spectroscopy, a few studies have allowed a kinematic characterisation of bulges in galaxies from Sb to Sd types. Ganda et al. (2006) carried out SAURON observations of 18 spiral galaxies with good Hubble Space Telescope photometry available. The velocity dispersion profiles of the galaxies were mostly flat or with positive gradients. Very few galaxies displayed negative gradients. When looking for correlations between these gradients and the morphological type of the galaxies, there was only a slight tendency for earlier types to displayed negative gradients. Positive gradients were not strongly correlated with latest Hubble types.
The study of velocity dispersion gradients will be soon expanding thanks to the large number of IFU surveys (DiskMass, Bershady et al. (2010); CALIFA, Sánchez et al. (2012)]; SAMI, Croom et al. (2012); MaNGA, Bundy et al. (2015)). However, it is important to remember that not all of them will allow the study of bulges in late-type galaxies due to restrictions in the spatial sampling or their spectral resolution.
So far in this review we have exposed the properties of different kind of bulges, and yet this has gone as far as showing that some bulges exhibit kinematics closer to what it is observed in a disk (e.g. rotation dominated) instead of the classical idea of bulges being pressure supported. Here we will revise the kinematic properties of the different structural components dominating the light in the inner regions of galaxies.
Counter-rotating components are common in galaxies. Large, kpc-scale, kinematically decoupled components (KDCs) are typically found in bright elliptical galaxies (e.g. Bender, 1988a, Franx et al., 1989, Carollo et al., 1997, Hau et al., 1999, Davies et al., 2001, Emsellem et al., 2014). They usually contain old stellar populations and are almost indistinguishable from the remaining body of the galaxy. Smaller decoupled components are, however, harder to identify, are made of young stars and reside in lower luminosity early-type galaxies (e.g. McDermid et al., 2006). Large-scale counter-rotation of disk components seems also not so rare: NGC 4550 (e.g. Rubin et al., 1992, Rix et al., 1992), NGC 4138 (Jore et al., 1996), NGC 4473 (Cappellari et al., 2004). See Krajnović et al. (2011) for other cases detected through a kinemetry analysis (Krajnović et al., 2006). The detection of such extreme cases keeps increasing as new kinematic decomposition techniques are developed (e.g. Coccato et al., 2013, Johnston et al., 2013, Pizzella et al., 2014).
Counter-rotation of bulges is an odd phenomenon. There are very few cases reported in the literature of bulges rotating around a completely different axis than their surrounding disks. One of those striking cases is NGC 4698 (Bertola et al., 1999), where the bulge appear to rotate perpendicular to the stellar disk. Another unusual case is that of NGC 7331, where the bulge was reported to counter-rotate with respect to the disk (Prada et al. (1996), but see Bottema (1999)). Numerical simulations suggest mergers of galaxies as the only viable path for the formation of such structures (e.g. Balcells & González, 1998, Thakar & Ryden, 1998).
A common feature is the presence of co-rotating components (e.g. a nuclear disk) embedded in an otherwise pressure supported spheroidal bulge . The key kinematic signature of these inner disks is a steep rise of the rotation velocity in the inner parts (i.e. faster than the expected rise of the main disk) accompanied by low velocity dispersions values. There is often also an anti-correlation between the velocity and h3 moment in the locations with lowest velocity dispersion, which is usually an indication of multiple kinematic components. All these features are shown in Figure 5 using the two-dimensional kinematic maps of NGC 4274 from Falcón-Barroso et al. (2006) as an example. The Hubble Space Telescope unsharped-masked image reveals the presence of a dusty disk in the inner regions of the galaxy, which is not so obvious in the reconstructed image of the galaxy. The disk has a clear signature in the velocity map, and even more so in the velocity dispersion which is much lower than the values of the surrounding dynamically hot bulge. In this particular case, the very low [Oiii] / Hβ emission line ratio suggests star formation is taking place in the inner disk. The presence of these co-rotating components do not always imply associated young stellar populations. The stellar population analysis carried out by Peletier et al. (2007) of the Falcón-Barroso et al. (2006) sample of 24 Sa galaxies concluded that about half of the galaxies displaying low central velocity dispersion values (so called σ-drops, Emsellem et al. (2001), Wozniak et al. (2003)) have mean luminosity weighted ages above 5 Gyr. The incidence of σ-drops in this sample was about 50%. σ-drops are not only produced by nuclear disks, but can also be caused by nuclear dust spirals and star-forming rings (Comerón et al., 2008). The origin of these components is often related to the inflow of gas, driven by bars, towards the inner regions of galaxies (e.g. Athanassoula, 2005). Note, however, that minor mergers could be also responsible for the formation of inner disks and rings in spiral galaxies (e.g. Eliche-Moral et al., 2011).
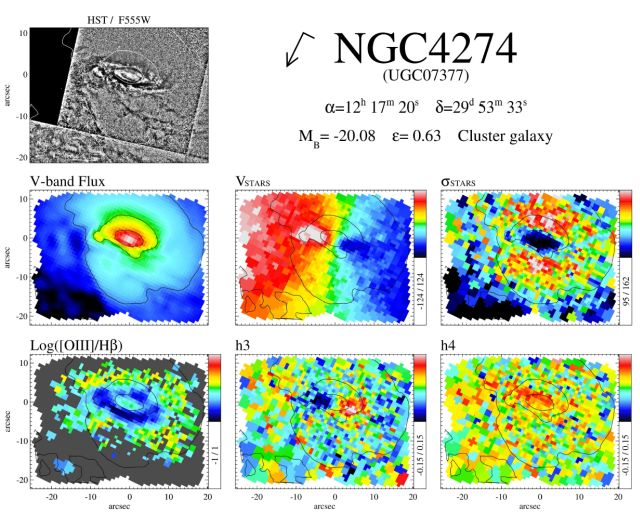 |
Figure 5. Stellar kinematic maps for NGC 4274 from Falcón-Barroso et al. (2006). The arrow and its associated dash at the top of each figure mark the north and east directions, respectively. (First row) HST unsharp-masked image of the galaxy and some basic information. (Second row) reconstructed total intensity (in mag/arcsec2 with an arbitrary zero point), stellar mean velocity V, and stellar velocity dispersion in km s−1). (Third row) [Oiii] / Hβ emission line ratio map (in logarithmic scale), and Gauss-Hermite moments h3 and h4 of the stellar line-of-sight velocity distribution. |
1 It is important to remember that properties observed in galaxies are result of integrating along the line of sight. This averaging depends greatly on the number of components as well as the type of stars contributing most to the light in that direction. Back.
2 Note that in this work the definition of a bulge differs from the one used in this review. While Fabricius et al. (2012) define bulges as structures with flux above the disk surface brightness profile, here they are also required to extend vertically above the disk. Back.