


The observational properties of the Bulge regarding the morphology, age and chemical abundances seem to be independently providing evidence for a rather complex bulge stellar population, where at least a metal-poor, alpha-enhanced population of old stars co-exists with a metal-rich, alpha-poor population of both old and a fraction of young stars (∼ 22% according to Bensby et al 2013a but see Clarkson et al 011C). It is then natural to evaluate how the kinematics of each of these populations can help to solve the puzzle and answer the question on what is the nature of each of these components.
Following the initial attempts to constrain the kinematics of the bulge stars by measuring their radial velocities (Frogel and Whitford 1987, Rich 1988, Rich 1990, Terndrup et al 1995, Minniti 1996, Sadler et al 1996, Tiede and Terndrup 1997) our understanding of the dynamical characteristics of the Bulge has gained an outstanding level of advancement thanks to the recent spectroscopic surveys that are able to sample radial velocities of thousands of M giants and red-clump stars across the Bulge.
In the most general view of Galactic bulge kinematics, the bulge is known to lie between a purely rotating system and a hotter system supported by velocity dispersion, with a Vmax / σ = 0.65 (Minniti and Zoccali 2008). The Bulge Radial Velocity Assay survey (BRAVA; Howard et al 2008, Kunder et al 2012) was the first to provide a broad view of the bulge kinematics, perhaps finally allowing us to start looking at the Bulge from an extragalactic perspective. The BRAVA survey presented the mean radial velocity and velocity dispersion as a function of longitude, at different Bulge latitudes, showing evidence for cylindrical rotation of the bulge (BRAVA; Howard et al 2008, Kunder et al 2012) which is a characteristic feature of box/peanuts originating from secularly evolved bars.
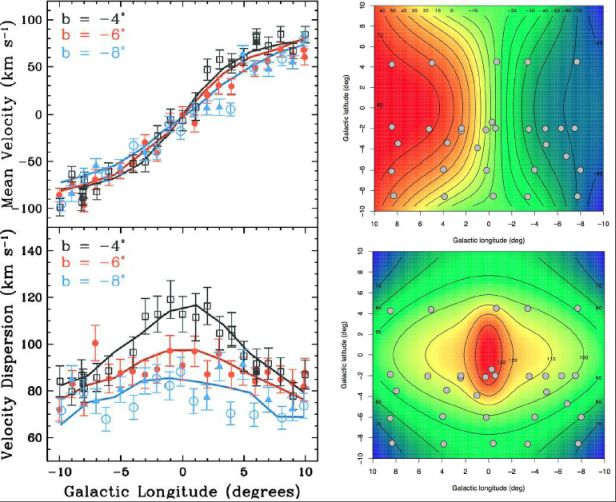 |
Figure 5. Left panels: Velocity dispersion profile (bottom) and rotation curve (top) for latitudes b = -4, -6, and -8 from Kunder et al (2012). Solid lines represent the models from Shen et al (2010). Right panels: Radial velocity (top) and radial velocity dispersion (bottom) surface in the longitude-latitude plane constructed from the measured rotation profiles at negative latitudes from the GIBS survey by Zoccali et al (2014). Grey points show the positions of the observed fields by the survey, while the black contour lines are labeled with the relevant velocity dispersion in km/s. [Left panel adapted from Fig. 11 in Kunder et al, 2012, ©AAS reproduced with permission. Right panels adapted from Fig. 10 and 11 in Zoccali et al, 2014, ©ESO reproduced with permission.] |
The cylindrical rotation seen in M giants of BRAVA, later confirmed using red-clump stars by the ARGOS (Ness et al 2013b) and GIBS (Zoccali et al 2014) surveys, was modelled by Shen et al (2010), who conclude that the bulge could not have any more than 8% of the disc mass in the form of a classical spheroid to reproduce BRAVA observations. Figure 5 shows the agreement between the BRAVA survey measurements at different latitudes compared to the pure disc models from Shen et al (2010). Also shown in Fig. 5 are the radial velocity and velocity dispersion maps for the Bulge constructed by Zoccali et al (2014) based on the GIBS survey observations.
However, dynamical models such as the one presented by Saha et al (2012) have shown that if a spheroidal component, i.e. a classical bulge, was already present when the bar was formed then the classical bulge could spin-up and rotate faster than expected for its dispersion supported nature due to the effects of the bar potential Saha and Gerhard (2013). In these conditions, the detection of such a component based in kinematics alone would be very difficult (Gardner et al 2014). Indeed, in order to understand the nature of these components the analysis of a connection between the kinematics and other stellar properties such as metallicity seems to be a key factor. Babusiaux et al (2010) investigated the connections of metallicity and kinematics, the latter based on radial velocities and proper-motions, for the sample of Zoccali et al (2008) at different latitudes along the bulge minor axis. They found that the high metallicity stars ([Fe/H] > -0.25) show a larger vertex deviations of the velocity ellipsoid than their metal-poor ([Fe/H] < -0.25) counterpart. Furthermore, metal-rich stars showed an increase in their velocity dispersion with decreasing latitude (moving closer to the galactic plane), while metal-poor stars show no changes in the velocity dispersion profiles. This information led Babusiaux et al (2010) to associate the more metal-rich stars with a barred population and the metal-poor stars with a spheroidal component or even the inner thick disc. The rotation curves and dispersion profiles of the large sample of stars from the ARGUS survey (Fig. 6) led Ness et al (2013b) to reach a similar conclusion to that of Babusiaux et al (2010).
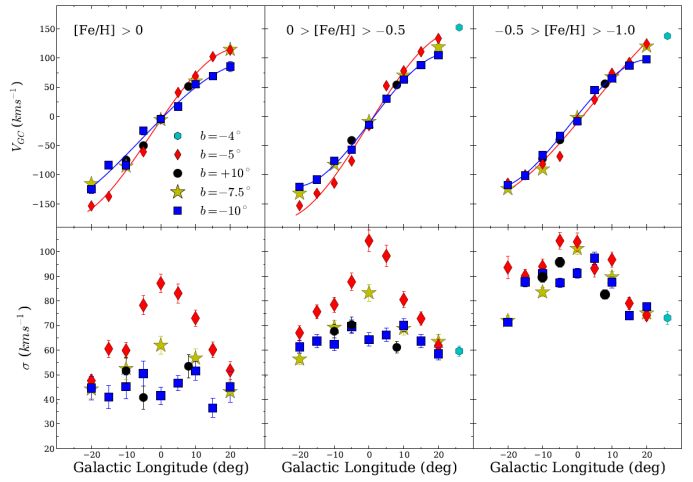 |
Figure 6. Rotation (top panel) and velocity dispersion (bottom panel) across the bulge for the 16600 stars from the ARGO survey with [Fe/H] > -1.0 within < 3.5 kpc of the Galactic Centre from Ness et al (2013b). The three plots correspond to different metallicity bins, from left to right in decreasing [Fe/H]. Note that the discrete bins are used to represent stars of components A, B and C from left to right shown in Fig. 4. Although the rotation curves are similar, the dispersion clearly demonstrates the difference in kinematics of stars with [Fe/H] > -0.5 and with [Fe/H] < -0.5. There are 3100, 8600 and 4900 stars in each plot, from left to right. The red diamonds are b = -5, the yellow stars are b = -7.5, the blue rectangles are b = -10 and the black circles are b = +10. [Figure adapted from Fig. 6 in Ness et al, 2013b]. |
 |
Figure 7. Comparison of the kinematics of the bright and faint red clump of the Bulge with respect to the kinematical model for a strong boxy-peanut bulge (Debattista et al 2005) obtained from Vásquez et al (2013). From the model, two samples were selected from the two overdensities formed by the near (red) and far (blue) arms of the boxy-peanut stellar distribution in the line of sight for (l,b) = (0, -6). Colour lines over U, V, and W histograms correspond to the median value for each distribution. [Figure adapted from Fig. 7 in Vásquez et al 2013, ©ESO reproduced with permission.] |
An additional piece of the puzzle has been provided thanks to the recent development of our understanding of the structural properties of the Bulge, in particular the discovery of the X-shape. Ness et al (2013b) and Vásquez et al (2013) investigated in more detail the connection between the X-shape bulge and its chemo-dynamical properties. Both studies showed that only the metal-rich stars ([Fe/H]> −0.5) trace the split red-clump in the luminosity function and therefore belong to the X-shaped bulge, while the metal-poor stars do not share the same split in magnitude.
Finally, important constraints on the bulge formation history can be obtained by looking at the radial velocities of a large number of stars. However, also having information on the proper motions for some of those stars in order to reconstruct the three-dimensional characteristics of the stellar orbits may become fundamental to disentangle the more complex characteristics of the Bulge. Although proper motions can be derived for large samples of stars based on photometric information obtained with relatively short exposure times, they require a long time baseline ( ∼ 10 yr). Therefore, to obtain a very precise astrometric solution in order to reach the required accuracy of a few mas/yr across the bulge is perhaps more a luxury than a requirement. Indeed, studies that have used proper motion information in specific fields, combined with radial velocity measurements, have been able to unravel the perhaps otherwise hidden complexity of the Bulge (e.g. Zhao et al 1994, Soto et al 2007, Babusiaux et al 2010). In this context, Vásquez et al (2013) provided for the first time an analysis based on both the radial velocities and proper motions for both arms of the X-shape bulge, and were thus able to derive the complete space velocities in the U, V, W Galactic Cartesian system for a sample of spectroscopic targets in the field (l,b) = (0,-6). As shown in Fig. 7, Vásquez et al (2013) showed how the closer over-density of the X-shaped bulge shows an excess of stars moving towards the Sun, and the far overdensity shows an excess of stars receding from the Sun, as expected from stars on elongated orbits streaming along the arms of the X-shaped bulge. A wider mapping of these are the key signatures of the detailed kinematics of the bulge, thus expanding the study of Vásquez et al (2013) to other Bulge regions, will become an important ingredient for an accurate modelling of the bulge and will perhaps allow a better identification of its different components (Gardner et al 2014).