


While obtaining spatially-resolved velocity maps is challenging for both stellar and gaseous components of individual high-redshift galaxies, important insights into the physical nature of cool halo clouds can be gained from comparing the distribution of relative velocities between absorbers and their associated galaxies. One important observable of cool halo gas is the line-of-sight velocity dispersion within the host halo. Using a sample of galaxy and absorber pairs, it is possible to constrain the ensemble average of the velocity distribution of absorbing gas relative to their host galaxies.
The distribution of relative velocity between Mg II absorbers and their host galaxies is shown in Figure 4 for both passive and [O II]-emitting LRGs. For the two LRG subsamples, the relative motion of Mg II absorbing gas is well centered around the systemic redshifts of the galaxies. While the velocity distribution around [O II]-emitting galaxies is well characterized by a single Gaussian of dispersion σv = 167 km s−1, a double Gaussian profile is required to characterize the relative motion of Mg II gas around passive LRGs with a narrow component of σvn = 163 km s−1 for the majority of the sample and a broad component of σvb = 415 km s−1. Roughly 12% of passive LRGs are found in the broad component with velocities exceeding 500 km s−1. These properties apply to both inner (d < 200 kpc) and outer (200 < d < 500 kpc) halos (see Huang et al., 2016, for a detailed discussion).
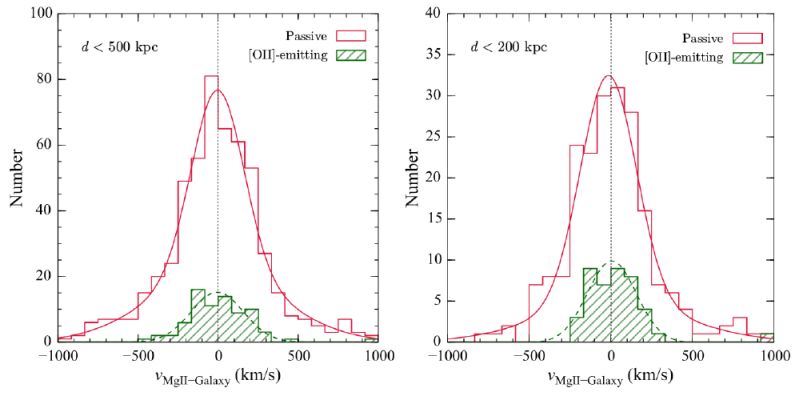 |
Figure 4. Velocity distributions of Mg II -absorbing clumps relative to the systemic redshifts of LRGs based on an ensemble of Mg II absorber and LRG pairs (adapted from Huang et al., 2016). The relative velocity distribution of Mg II-absorbing gas relative to passive LRGs is shown in the red open histogram, while the velocity distribution of Mg II absorbing gas relative to [O II]-emitting LRGs is shown in the green hatched histogram. Including all Mg II absorbers at d < 500 kpc of an LRG (left panel), the velocity distribution of the gas is well characterized by a single Gaussian distribution centered at ⟨ vMg II − Galaxy⟩ = −5 km s−1 with a dispersion of σv = 167 km s−1 (green, dashed curve). At the same time, a double Gaussian profile is required to better characterize the velocity distribution of Mg II absorbing gas around passive LRGs (red solid curve) with a narrow component centered at ⟨ vMg II − Galaxy⟩ = −3 km s−1 and σvn = 163 km s−1 and a broad component centered at ⟨ vMg II − Galaxy⟩ = −17 km s−1 and σvb = 415 km s−1. Roughly 12% of passive LRGs have a Mg II absorber found at velocities exceeding 500 km s−1 from the systemic redshifts of the galaxies. Consistent velocity distributions are found for Mg II absorbers detected at d < 200 kpc from passive and [O II]-emitting galaxies (right panel), showing little variation in the overall gas motion between inner and outer halos. |
The implications of Figure 4 are two-fold. First of all, the similarity in the relative velocity distribution of Mg II absorbing gas around passive and [O II]-emitting LRGs reaffirms the findings from the previous section (Section 3) that the observed Mg II absorbers are unlikely to originate in outgoing materials from the LRGs. Secondly, the mean halo mass of LRGs is Mh ≈ 3 × 10¹³ M⊙ (e.g. Mandelbaum et al., 2008, Gauthier et al., 2009). The expected line-of-sight velocity dispersion for virialized gas in these massive halos is σh ≈ 265 km s−1. The observed velocity dispersion of Mg II absorbing gas in ≈ 90% of the LRG sample (the narrow component in Figure 4) is merely 60% of what is expected from virial motion (see also Zhu et al., 2014), namely
 |
(2) |
Such suppression in gas motion not only indicates that the gas is gravitationally bound in the LRG halo but also that the kinetic energy of the gas is being dissipated. Similar suppression in the line-of-sight velocity dispersion is also found for Lyα and O VI absorbing gas around COS-Halos red galaxies with Mstar ≳ 1010.7 M⊙ (Tumlinson et al., 2011, Tumlinson et al., 2013).
In the presence of a hot halo (e.g. Hand et al., 2011), cool clumps should experience a ram-pressure drag force and slow down. For ram-pressure to drive decelerations in the clump motion, these clumps cannot be too massive. The observed suppression in the velocity dispersion of the absorbing gas therefore places a mass limit on these clumps. Following the formalism of Maller & Bullock (2004), a maximum clump mass can be estimated for the LRG halos according to mcl ≈ 5.1 × 10⁴ M⊙ T6−3/8(Λz t8)1/2, where T6 is the halo gas temperature in units of 106 K, Λz is the cooling parameter that varies with the gas metallicity Zg and t8 = tf(ch) / 8 Gyr is the halo formation time that depends on the halo concentration ch. For a halo temperature of T ∼ 6 × 10⁶ K for the LRGs and t8 ∼ 8.9 Gyr using ch ∼ 10 from the halo mass–concentration relation (e.g. Mandelbaum et al., 2008), the estimated mass of individual Mg II absorbing clumps is mcl ≈ 5 × 10⁴ M⊙ for solar metallicity and lower for lower-metallicity (see Huang et al., 2016, for more details).
Beyond an ensemble average over a large sample of LRG-Mg II pairs, comparisons of gas and satellite kinematics in individual halos are possible when deep galaxy survey data are available (e.g. Steidel et al., 1997, Whiting et al., 2006, Nestor et al., 2007, Chen & Mulchaey, 2009). Previous studies that combined absorber and galaxy data have revealed a number of metal-line absorbers associated with overdensities of galaxies over a wide range of mass scales (e.g. Mulchaey & Chen, 2009, Kacprzak et al., 2010, Nestor et al., 2011, Gauthier, 2013, Johnson et al., 2013). Comparing the observed line-of-sight velocity dispersion of the absorbing gas with the velocity distribution of galaxy group members offers additional clues for the origin of chemically-enriched gas in overdense environments. In particular, imaging and spectroscopic surveys of galaxies in the vicinities of ultra-strong Mg II absorbers, Wr(2796) ≳ 3 Å, have revealed multiple galaxies at small projected distances and velocity separations from these absorbers (e.g. Nestor et al., 2007, Nestor et al., 2011, Gauthier, 2013). With the expected velocity spread of ∼ 100 km s−1 per Angstrom for Mg II absorbers, the large Wr(2796) implies a line-of-sight velocity spread of the components Δv > 300 km s−1. Attributing the observed gas motion to the underlying gravitational potential of the host dark matter halo would lead to a halo mass exceeding Mh ≈ 3 × 10¹² M⊙.
Figure 5 showcases an example of an ultra-strong Mg II absorber of Wr(2796) = 4.2 Å identified at z = 0.5624 along the sightline toward a background QSO at zQSO = 1.30 (Gauthier, 2013). Four galaxies are spectroscopically identified at close projected distances and velocity separations from the absorber, including a 3.5-L* LRG at d = 246 kpc and Δv = −385 km s−1, a 1.8-L* passive galaxy (A) at d = 55 kpc and Δv ≈ 0 km s−1, a 0.3-L* galaxy (B) at d = 38 kpc and Δv ≈ −100 km s−1, and a 0.5-L* galaxy (G) at d = 209 kpc and Δv ≈ 0 km s−1. Only galaxies B and G exhibit traces of on-going star formation with an inferred star formation rate of ≈ 3 M⊙ yr−1. The total stellar masses of the galaxies range from Mstar ≳ 4 × 10¹⁰ M⊙ for galaxy A and the LRG to Mstar ≈ 3 × 10⁹ M⊙ for galaxies B and G. The close proximity and the observed massive stellar content qualify these galaxies as parts of a galaxy group with a light-weighted center at dgroup ≈ 156 kpc and Δ vgroup = −200 km s−1. The total dark matter halo mass of the group estimated based on the stellar mass of the LRG is Mh ≈ 1013 M⊙ e.g. Behroozi et al. (2010).
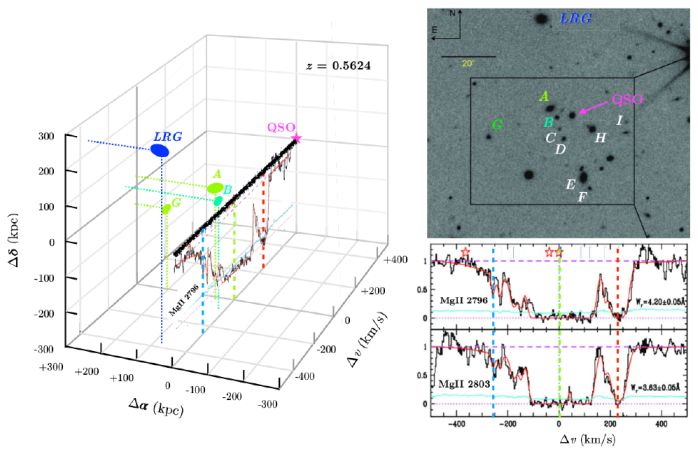 |
Figure 5. Comparison of galaxy and Mg II absorption gas kinematics observed in a group of galaxies at z = 0.5624 (Gauthier, 2013). The imaging panel and absorption-line profiles on the right are adapted from Gauthier (2013). An ultra-strong Mg II absorber of Wr(2796) = 4.2 Å (lower-right panel) is identified at z = 0.5624 along the sightline toward a background QSO at zQSO = 1.30. Follow-up spectroscopy of galaxies in this field (upper-right panel) revealed an LRG at d = 246 kpc and Δv = −385 km s−1, along with three additional galaxies, A, B, and G at closer distances and relative velocities from the Mg II absorber. Galaxies C − F, H, and I are found to be at lower redshifts from the galaxy group at z = 0.56. The left panel displays the spatial and relative velocity distribution of the LRG and three neighboring galaxies relative to the Mg II absorber. The luminosities of the LRG and galaxies A, B, and G are 3.5, 1.8, 0.3, and 0.5 L*, respectively. The galaxies are color-coded according to the relative velocities from the Mg II absorber at Δv = 0 km s−1. Galaxies A and G, marked in pale green, occur at Δv ≈ 0 km s−1, while the LRG, marked in blue, displays the largest blue-shifted relative velocity with Δv = −385 km s−1. The most blue-shifted and redshifted Mg II components at Δv ≈ −250 and 230 km s−1 are also marked in pale blue and red, respectively, to guide the visual comparison. |
The star formation rate intensity observed in galaxies B and G is small (Gauthier, 2013), which indicates that super galactic winds are unlikely to form and drive outflows in these galaxies (e.g. Heckman, 2002, Heckman et al., 2015). On the other hand, the large line-of-sight velocity spread of the absorbing gas, from Δv ≈ −250 to Δv ≈ 230 km s−1 (lower-right panel), is comparable to the projected velocity dispersion expected from virial motion, σvir ≈ 190 km s−1, in a halo of Mh ≈ 1013 M⊙ at z = 0.5. This agreement suggests a physical connection between group dynamics and ultra-strong Mg II absorbers. A comparable velocity dispersion between absorbing gas and group galaxies has also been found for a Mg II absorber of Wr(2796) = 1.8 Å at z = 0.3, for which a group of five sub-L* galaxies are found at d < 250 kpc and |Δ v| < 250 km s−1 (Kacprzak et al., 2010). The dynamical mass of the host dark matter halo, based on the velocity dispersion of the group members σv = 115 km s−1, is Mh ≈ 3 × 10¹² M⊙ for the galaxy group at z = 0.3. In both cases, where a strong Mg II is found in a galaxy group, dissipation is not observed in the relative motion between the absorbing gas and associated galaxies. The large velocity dispersion, similar to the broad velocity component seen in Figure 4, can be understood if the ram-pressure drag force is subdominant in comparison to the gravitational force on the gas clumps. Stripped gas due to tidal interactions between neighboring galaxies is a likely explanation for the dynamically complex Mg II absorbers found in group or cluster environments (e.g. Chynoweth et al., 2008, Marasco et al., 2016), which also results in H I depleted galaxies in these massive cluster and group halos (e.g. Verdes-Montenegro et al., 2001, Chung et al., 2009).
Galaxy surveys have been carried out for two more ultra-strong Mg II absorbers at z ≈ 0.7. Both are found in a group environment with Mh = 1012−13 M⊙ (Nestor et al., 2011). However, high-resolution spectra are not available for these two absorbers and consequently comparisons of gas and galaxy kinematics are not possible.