


For galaxy spectroscopy to successfully constrain the kinematics of absorption lines along the line of sight, it must have sufficient continuum S/N in the spectral range surrounding the transition in question. The limiting S/N depends in detail on a number of factors, including the typical equivalent width of the transition and the complexity of the absorption line analysis employed. Studies testing this limit and adopting a simple, “single component” analysis have required between S/N ∼ 5 Å−1 (Rubin et al. 2014) and S/N ∼ 15 Å−1 (Sato et al. 2009).
Many of the first works to attempt constraints on the kinematics of such absorption transitions in galaxies not specifically selected to be starbursts – i.e., in magnitude-limited galaxy samples representative of “typical” star-forming or quiescent objects – used datasets which did not broadly satisfy these S/N requirements (Weiner et al. 2009, Rubin et al. 2010, Chen et al. 2010b, teidel et al. 2010). Each of these studies were leveraging spectroscopic samples obtained for the primary purpose of conducting a redshift survey, rather than an assessment of cool gas kinematics. As a result, these works often resorted to co-adding subsamples of tens or hundreds of spectra to achieve the S/N required for absorption line analysis. Moreover, this co-added spectroscopy yielded absorption profiles which were universally asymmetric with excess equivalent width blueward of the galaxies' rest frame. The first detections of redshifted absorption profiles were reported only in later studies which obtained high-S/N spectroscopy of individual galaxies.
2.1. First Reports of Inflow Observed Down the Barrel
The very first detections of redshifted self-absorption made use of some of the highest-S/N spectroscopy obtained during the execution of the DEEP2 redshift survey (Davis et al. 2003). In their discussion of a massive ultraluminous infrared galaxy with an X-ray-bright central AGN at z = 1.15 located in the AEGIS survey field (Davis et al. 2007). Le Floc'h et al. (2007) commented on strong Ca II H & K absorption lines which were redshifted by ∼ 150−200 km s−1 relative to the velocity of [O II] emission from the host.
Shortly thereafter, Sato et al. (2009) significantly expanded the sample of redshifted self-absorption detections through their analysis of Na I D kinematics in a S/N-limited subsample of the DEEP2 survey of the Extended Groth Strip. The parent DEEP2 sample was magnitude-selected to R < 24.1, such that it contained substantial populations of both star-forming and passive galaxies. However, Sato et al. (2009) found that they required at least S/N ∼ 6.5 pix−1 in the rest-frame continuum around Na I D to constrain its velocity to within a 68% confidence interval spanning less than ∼ 200 km s−1. This limited their analysis sample to 205 objects at 0.11 < z < 0.54, about 75% of which are “red sequence” galaxies. Outflows and inflows are reported in this work if the fitted Na I centroid is shifted from systemic velocity by more than ±50 km s−1, and occur in nearly equal numbers: outflows are detected in 32 objects, while inflows are detected with high confidence in 31 objects.
The Na I profiles shown in the left-hand panel of Fig. 1 demonstrate the typical quality of the data used in this analysis. As the two transitions in the Na I D doublet are separated by only ∼ 300 km s−1, the lines are blended in these spectra due to the large intrinsic velocity of both the stellar and gas components giving rise to the observed absorption. The velocity v(Na I D) = 0 km s−1 on the x-axis corresponds to the rest wavelength of the 5897 Å doublet transition. The authors show their best-fit absorption line model for each spectrum with colored curves, and mark the corresponding best-fit velocity of the λ 5897 Å transition with vertical dotted lines. The top-most spectrum exhibits significantly redshifted absorption with a fitted velocity of ∼ +80 km s−1.
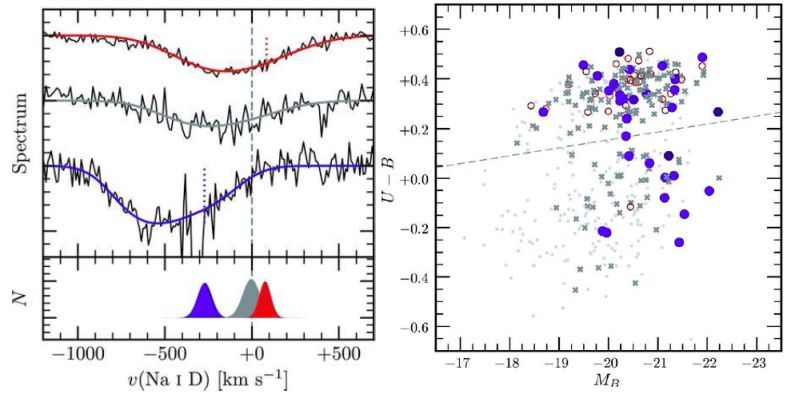 |
Figure 1. Spectroscopy and photometry of the sample analyzed in Sato et al. (2009), the first study to report and characterize gas accretion onto distant galaxies. Left: Continuum-normalized spectra showing the region around the Na I doublet (black). v = 0 km s−1 is set at the systemic velocity of the λ 5897 doublet transition. The colored curves show the best-fit absorption line models, and the vertical dotted lines show the corresponding best-fit velocity of the λ 5897 line. The bottom panel shows the marginalized probability distributions of the model profile velocity for each spectrum, obtained from a Markov Chain Monte Carlo sampling of the absorption line profile parameters. Right: Rest-frame color-magnitude diagram showing the full sample. Objects exhibiting outflows are marked with blue filled circles; those exhibiting redshifted absorption are marked with red open circles; and gray crosses mark objects which exhibit neither significant blueshifts nor redshifts in their Na I profiles. The light gray dots indicate objects whose spectra lack the S/N required to constrain their absorption line kinematics. The dashed line divides the blue cloud and red sequence populations. Panels are reproductions of Figures 4 (left) and 10 (right) from the article “AEGIS: The Nature of the Host Galaxies of Low-Ionization Outflows at z < 0.6”, by T. Sato et al. (2009, ApJ, 696, 214). ©AAS. Reproduced with permission. |
Sato et al. (2009) note that while a significant fraction of the galaxies in their sample which exhibit outflows are star-forming and lie in the so-called “blue cloud” (blue symbols; Fig. 1, right), all but one of the objects exhibiting inflows occupy the red sequence (red symbols; Fig. 1, right). In interpreting this finding, they caution that there may be additional absorption features arising from the stellar populations in these systems which are not yet understood, and which could in principle shift the minimum of the stellar continuum flux near λobs ∼ 5890−5900 Å redward of the rest wavelengths of Na I D. Line-profile fitting of such features could in turn be mistakenly interpreted as redshifted interstellar absorption. However, the authors also report that many of the inflow galaxies in their sample exhibit optical emission line ratios ([N II] / Hα) consistent with Seyfert or LINER activity, and draw an intriguing comparison to the inflows observed in neutral hydrogen in the inner regions of radio-bright elliptical galaxies (van Gorkom et al. 1989). They speculate that the observed absorbing gas may in fact feed this central activity.
2.2. Inflows onto AGN-Host Galaxies
Since the publication of this novel and important work, there have been several studies corroborating the detection of inflow toward galaxies hosting active AGN. Krug et al. (2010) explored Na I D kinematics in a sample of Seyfert galaxies selected to be infrared-faint (with 109.9 < LIR / L⊙ < 1011). Previous studies of Na I D absorption toward nearby galaxy samples had targeted infrared-bright starburst or starburst/AGN composite systems (Rupke et al. 2005b, a, Martin 2005), and had detected outflows in the majority of these objects. A primary goal of Krug et al. (2010) was to develop a comparison sample of objects without ongoing starbursts to determine the relative contributions of star formation vs. AGN activity in driving these winds. The authors obtained spectroscopy of 35 galaxies using the RC Spectrograph on the Kitt Peak 4m telescope. With a median S/N near Na I D of ∼ 85 Å−1 and a spectral resolution of 85 km s−1, they performed both single- and double-velocity component absorption line model fits with typical central velocity uncertainties of < 50 km s−1.
In contrast to previous studies of starbursting systems, Krug et al. (2010) detected outflows traced by Na I in only 4 galaxies (11% of their sample) and instead detected inflows in over a third (13 galaxies) of their sample. The central velocities of these flows ranged from just over +50 km s−1 to +140 km s−1; however, no significant correlation between inflow kinematics and host galaxy mass, infrared luminosity, or inclination was observed. From this analysis, the authors concluded that star formation rather than AGN activity makes the dominant contribution to the driving of outflows (Krug et al. 2010). Furthermore, they speculated that the high observed inflow velocities are suggestive of material located close to the galaxy nuclei rather than in the outskirts of the disks. They also searched for signs of nuclear morphological features which could indicate that the inflowing material is undergoing angular momentum loss, finding that 5 galaxies in their inflow sample exhibit nuclear dust spirals, bars, or rings. Five additional inflow galaxies have nearby companions with which they may be interacting. Such phenomena are thought to be required in order to facilitate the inflow of gas toward galaxy nuclei and its ultimate accretion onto the central black hole.
The high quality of these data also permitted a rough estimate of the rate of mass inflow onto these systems via constraints on the Na I column density. Assuming a factor of 10 ionization correction (i.e., that N(Na) / N(Na I) = 10), a metallicity approximately twice the solar metallicity, and that the absorbing gas is at a distance of r = 1 kpc from the nucleus, it is estimated to be flowing inward at (1 − 5) r / (1 kpc) M⊙ yr−1. This rate is approximately two orders of magnitude larger than the mass accretion rate required to power a typical Seyfert nucleus (Crenshaw et al. 2003, Krug et al. 2010). These cold gas inflows may therefore serve as an important fueling mechanism for AGN activity in these objects.
Yet further evidence for massive inflows of gas onto AGN-host galaxies was reported b Stone et al. (2016), who studied molecular gas kinematics in a sample of 52 local AGN selected from the Swift-Burst Alert Telescope Survey of hard X-ray objects. The Stone et al. (2016) targets thoroughly sample the AGN luminosity function to its brightest end. The authors analyzed spectroscopy of these systems covering the OH 119µm feature obtained with the Herschel/PACS far-IR interferometer, detecting the transition in absorption in 17 sources. As in the Krug et al. (2010) study discussed above, only a handful (four) of these 17 AGN exhibited molecular outflows, while the OH absorption feature was redshifted by > 50 km s−1 in seven of their targets (corresponding to a detection rate of ∼ 40%). The authors suggested that the significantly lower detection rates of inflows toward IR-luminous galaxies may be due to the disruption of these accretion flows by the faster winds driven by their central starbursts.
2.3. Inflows on the Smallest Scales: Feeding Luminous QSOs?
Spectroscopy of bright quasars also probes gas flows toward the central source (i.e., the AGN), and can be obtained with much greater efficiency than faint galaxy spectroscopy. Indeed, the SDSS-I/II and SDSS-III BOSS redshift surveys have now revealed several instances of redshifted absorption observed toward bright QSOs (Hall et al. 2002, 2013). These profiles occur in quasars with “broad” absorption lines (BAL), defined to extend over thousands of km s−1 in velocity (Allen et al. 2011). In addition, the absorption typically only partially covers the emitting source. The vast majority of BAL QSOs exhibit absorption troughs lying entirely at velocities blueward of systemic, and are thought to arise from AGN-driven feedback/outflow. However, in their search through more than 100,000 SDSS/BOSS QSO spectra, Hall et al. (2013) discovered 19 BAL objects in which the trough in at least one transition extends to velocities v > 3000 km s−1. These authors estimated that such redshifts occur in approximately 1 in every 1000 BAL quasars.
This work discusses several different physical scenarios which may explain the observed extreme absorption. The accretion of material onto the host dark matter halo or host galaxy at kpc-scale distances from the central source may certainly contribute to the redshifted absorption signal; however, the free fall velocity of such material is expected to be only a few hundred km s−1. For gas to achieve an infall velocity v > 3000 km s−1, it must reach scales as small as a few hundred Schwarzschild radii (Hall et al. 2013). It remains to be established whether infalling gas clumps can maintain sufficiently high densities at such small distances to give rise to absorption in the observed transitions (e.g., Si IV, C IV, Al III λ λ 1854, 1862, Mg II). Hydrodynamical simulations of accretion flows onto a supermassive black hole may be used to address this question; e.g., Li et al. (2013); however, detailed predictions of absorption profile shapes in multiple transitions are needed for a quantitative comparison to the observations. Alternative scenarios which could give rise to redshifted, broad absorption include gravitational redshifting of a spherically symmetric wind; rotating accretion disk winds observed toward an extended emission source; outflow from a second QSO close in the foreground to the first; or even the relativistic Doppler effect of outflowing ions absorbing photons of lower frequency due to time dilation. Hall et al. (2013) concluded that none of these mechanisms can individually explain the observations; however, they suggest that both rotationally-dominated accretion disk winds and infalling material are likely contributing to the redshifted broad absorption profiles.
In some instances, these data may also constrain the distance between the absorbing material and the central black hole. Shi et al. (2016) analyzed one of the BAL QSOs discussed in Hall et al. (2013), reporting the detection not only of redshifted Mg II and Fe II line profiles but also redshifted hydrogen Balmer and He I* λ 3889 absorption. The latter transition is highly sensitive to the number of ionizing photons impinging on the gas per ion (U), while Balmer absorption lines generally arise only in very high-density environments (n(H) > 106 cm-3; Shi et al. 2016). Together with an estimate of the ionizing luminosity of the QSO, constraints on both U and n(H) from analysis of the He I* and Balmer lines imply a distance of rabs ∼ 4 pc for this particular absorbing system. Shi et al. (2016) note that this distance is much larger than expected for a rotating disk wind or a gravitationally redshifted AGN outflow, and suggest that it is instead consistent with infall from the inner surface of a dusty torus surrounding the accretion disk (Barvainis 1987). Detailed analysis of a larger sample of similar systems has the potential to more conclusively establish the frequency of such infall events, the mass of material involved, and their overall contribution to the fueling of bright QSOs.
Apart from the BAL phenomenon, QSOs are observed to exhibit numerous other classes of foreground absorbers. One such class – that of ‘proximate' absorbers – differs from BALs primarily in that they have significantly more narrow velocity widths (< 100 km s−1). Proximate absorbers are typically defined to have a central velocity within < 10,000 km s−1 of the QSO emission line redshift, and are often (though not always) observed to fully cover the emitting source (Ellison et al. 2010). Recently, Fathivavsari et al. (2016) presented a sample of six z ∼ 2 QSOs in which a proximate damped Lyα (DLA) absorber entirely eclipses the broad Lyα emission from the central AGN. They report that in five of these systems, the absorber has a velocity ∼ 100−1200 km s−1 redward of the QSO systemic velocity, speculating that the absorption traces infalling material. However, because this work relies on spectroscopy of broad QSO emission lines to constrain the host galaxy redshift (e.g., C IV, C III] λ1909, He II λ 1640), these estimates suffer from significant systematic uncertainties (∼ 200 − 500 km s-1; (Shen et al. 2016). Followup spectroscopy covering [O II] λ3728 or [O III] λ 5007 in the near-infrared will be important for verifying this intriguing finding.
2.4. Inflows onto Early-Type and Post-Starburst Galaxies
Concomitant with the assembly of this compelling evidence for gas accretion onto active AGN, two studies offered additional empirical support for inflow onto red sequence galaxies, or galaxies exhibiting signs of recent quenching. In the first study to obtain rest-frame near-UV galaxy spectroscopy of sufficient depth for analysis of Fe II λλ 2586,2600 and Mg II λλ 2796, 2803 absorption in individual sightlines, Coil et al. (2011) targeted a sample of 10 X-ray-luminous AGN and 13 post-starburst galaxies at 0.2 < z < 0.8 selected from the DEEP2 and SDSS redshift surveys. The AGN are moderately luminous, with log(LX / erg s−1) ∼ 41−42, while the post-starbursts were identified via a decomposition of their optical spectroscopy into old and young stellar population components. Those objects for which spectral fitting yielded a relatively luminous young component (contributing at least 25% of the continuum at λrest ∼ 4500 Å) and which exhibited little or no Hβ emission were targeted. The Keck/LRIS spectroscopy obtained for this study traced blueshifted absorption in 60% of the AGN and 31% of the post-starbursts, but also yielded redshifted absorption profiles in two of the latter. These redshifts were detected in Mg II (and in one case in Mg I λ 2852) at speeds of 75 − 115 km s−1, but were not detected securely in Fe II absorption. While it is difficult to draw definitive conclusions from such small sample sizes, the ubiquitous detection of Mg II and Fe II absorption in excess of that predicted for the stellar continuum in these spectra suggests that the mechanism causing the cessation of star formation did not completely deplete the gas supply in these systems.
Most recently, Sarzi et al. (2016) undertook a study of Na I absorption in SDSS spectra of galaxies selected to have high-spatial-resolution 20cm continuum coverage obtained with the Very Long Baseline Array (Deller et al. 2014). Nearly 60% of this sample are early-type galaxies, and the vast majority of these early types do not exhibit blueshifted Na I. The authors briefly comment on their detection of redshifted absorption in ∼ 10 − 20 objects, most of which either exhibit very weak optical emission lines or LINER/Seyfert-like emission line ratios. It is suggested that this phenomenon may be the signature of bars or unsettled dust lanes in these systems.
In summary, cool gas kinematics have now been assessed in relatively small samples of early-type and/or AGN-host galaxies. Measurements of Na I absorption velocities toward red sequence systems suggest a ∼ 20% incidence rate of redshifted profiles (Sato et al. 2009). Spectroscopy of Seyfert galaxies and X-ray-selected AGN reveals a yet higher incidence (∼ 40%) of redshifted Na I or OH absorption (Krug et al. 2010, Stone et al. 2016). These rates are approximately the same or higher than the outflow detection rates for the same samples: ∼ 14% for the red sequence sample of Sato et al. (2009) and ∼ 10−25% for the Seyfert and BAT/AGN samples of Krug et al. (2010) and Stone et al. (2016). While the mass of these flows remains poorly constrained, the similar rates of these phenomena may ultimately point to a “steady state” of gas cycling through such systems (even as they maintain very low rates of star formation).
It should also be noted, however, that the physical scale over which these flows occur may in fact be limited to the regions very close to or within the galaxies' stellar component. The common use of Na I in the aforementioned studies naturally biases these assessments to tracing the motions of cold, dust-enshrouded material, which in red-sequence galaxies may in fact lie in dust lanes or cold molecular disks (Sato et al. 2009, Davis et al. 2011). Spectroscopy of additional transitions tracing gas over a broader range of density and temperature (e.g., Mg II or Fe II) will be important for developing constraints on the physical state and scale of these flows.