


Absorption by neutral atomic hydrogen in luminous spiral galaxies provides an excellent tool to study the gas kinematics in their nuclear regions. Whereas from emission studies it is difficult to interpret the observed radial velocities, absorption measurements have the advantage that the detected lines must come from the near side of the nucleus. So, red-shifts or blue-shifts relative to the systemic velocity of the galaxy, vsys, unambiguously show infall or outflow of gas, respectively. Since the absorption lines are intrinsically narrow as a result of the low temperatures of the optically thick gas, typically 30 to 150 K (Dickey, Salpeter & Terzian 1979), it is surprising that numerous galaxies show HI absorption over a broad range of velocities (a few hundred km s-1); see e.g., Fig. 1. Some examples are found in the absorption surveys by Mirabel (1982) and Mirabel & Sanders (1988), using the Arecibo telescope, and by Dickey (1982, 1986), obtained with the large configurations of the VLA.
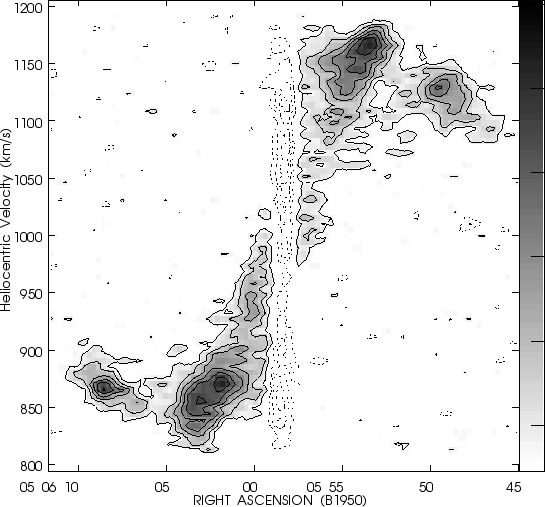 |
Figure 1. Major-axis position-velocity diagram of the starburst galaxy NGC 1808 (Koribalski, Dickey & Mebold 1993). We assumed a position angle of 320° (see also Fig. 5 and 6). The contour levels are -4.5, -3, -1.5, 1.5, 3, 4.5, 6, 7.5, and 9 mJybeam-1. These data were taken with the VLA BnC array; the resolution is about 15" × 20" × 5 km s-1. — Note that both HI emission (solid lines) and absorption (dotted lines) cover about the same velocity range. |
Interferometric studies of individual bright galaxies, e.g., NGC 253, NGC 660, NGC 1068, NGC 1365, NGC 1808, M 82, NGC 3079, NGC 3628, NGC 4945, etc. reveal HI emission and absorption over about the same velocity range. And many more galaxies can be added to the sample (see Table 1). It is remarkable that these are all barred galaxies with high central activity and far-infrared (FIR) luminosities of a few 1010 L⊙ (see Tables 2 and 3), often revealing outflow of gas from the central region. They also frequently contain megamasers and Seyfert nuclei although the starburst activity usually dominates the total power output.
Sérsic & Pastoriza (1965) had already noted that galaxies with peculiar nuclei, e.g., NGC 1097, NGC 1365, NGC 1808, and NGC 7552 (most of them containing `hot spots', i.e., extremely bright HII regions), are barred (SB or SAB), strongly indicating a relationship between the nuclei of galaxies and their whole structure. My main aim is to investigate further the nature of this relationship.
To understand the nuclear kinematics in these galaxies – which are probably very much alike – sensitive high-resolution HI observations need to be carried out which can at least partly resolve the central continuum. A summary of our high-resolution ATCA observations is given in Section 3. Section 4 contains a literature review of the sample of galaxies described above, including some of our new results, and a comparison with strongly interacting galaxies and others with broad HI absorption lines. As a summary I present a global model in Section 5.
| Name | vabs range | Δvabs | vem range | Δvem | gradient | Ref. |
| [k ms-1] | [km s-1] | [km s-1 arcsec-1] | ||||
| NGC 253 | 75-330 | 255 | 75-400 | 325 | (a) | |
| NGC 660 | 640-1050 | 410 | 675-1050 | 375 | 87 | (b) |
| NGC 1068 | 760-1300 | 540 | 900-1300 | 400 | (c) | |
| NGC 1365 | 1473-1786 | 313 | 1432-1840 | 408 | (d) | |
| NGC 1808 | 820-1180 | 360 | 810-1190 | 380 | 13 | (e) |
| NGC 3034 | 66-375 | 309 | 50-380 | 330 | (f) | |
| NGC 3079 | 840-1420 | 580 | 860-1420 | 560 | 500 | (g) |
| NGC 3628 | 650-1080 | 430 | 670-1020 | 350 | 27 | (h) |
| NGC 4945 | 380-740 | 360 | 355-750 | 395 | (j) | |
| Circinus | 350-550 | 200 | 285-590 | 295 | (k) | |
| NGC 6221 | 1300-1650 | 350 | (l) | |||
| NGC 7552 | 1500-1700 | 200 | 1460-1760 | 300 | (l) | |
| NGC 7582 | 1380-1780 | 400 | 1380-1810 | 430 | (l) | |
| Column (1): Galaxy name. Columns (2)-(5): The velocity range observed in HI absorption and emission, respectively. Column (6): Lower limit to the velocity gradient of the HI absorption feature, when resolved. Column (7): References. (a) Dickey, Brinks & Puche 1992; (b) Gottesmann & Mahon 1990; Baan, Rhoads & Haschick 1992; (c) Gallimore et al. 1994; Brinks et al. 1995; (d) Jörsäter & van Moorsel 1995; (e) Koribalski, Dickey & Mebold 1993; (f) Weliachew, Fomalont & Greisen 1984; Crutcher, Rogstad & Chu 1978; (g) Irwin & Seaquist 1991; Baan & Irwin 1995; (h) Schmelz, Baan & Haschick 1987; Wilding, Alexander & Green 1993; (j) Ables et al. 1987; (k) Koribalski & Whiteoak 1996; (l) Koribalski, Lavezzi, Dickey & Whiteoak 1996. | ||||||
There are mainly two questions to be addressed: 1) What causes the large velocity width (several hundred km s-1) of the absorption lines detected against the nuclear regions of galaxies? 2) Why are the absorption line widths observed against the nuclear radio continuum similar to those measured in emission over the whole extent of the galaxy? The problem is illustrated well in Fig. 1 which shows a typical HI position-velocity diagram of a starburst galaxy (here NGC 1808); both the HI emission and absorption lines cover nearly 400 km s-1. To address these question one should first examine the conditions for observing neutral hydrogen gas in absorption 3: we need cold atomic hydrogen gas (≲ 150 K) in front of a rather strong continuum source. Then, there are mainly two explanations for the large velocity range observed in absorption. The gas is either A) in turbulent motion or B) in a regular Keplerian orbit around the nucleus. Case A) means there are numerous cold gas clouds falling into and ejected out of the nuclear region. To explain the similar velocity range for emission and absorption the clouds are required to have maximum velocities similar to the rotation amplitude of the galaxy. This model is, e.g., strongly favoured by Mirabel & Sanders (1988) who in their paper conclude that ``... in the central regions of the most luminous infrared galaxies there must be high concentrations of turbulent atomic gas enshrouding the nuclear radio-continuum source.'' Case B) requires rather high rotational velocities close to the nucleus and was therefore often rejected. But now that interferometers and VLBI techniques are used to resolve the nuclear continuum structure in galaxies those high rotation velocities have been found in nearly all cases (see Section 4). Most of the large absorption line widths can be reproduced if the rotation amplitude in the nuclear region is similar to that in the outer region of the galaxy. This requires either a rather flat rotation curve or two components with similar amplitude as for example present in the Galactic rotation curve (Dame et al. 1987). In some cases the inner part of the rotation curve has to rise toward the nucleus to explain absorption line widths much larger than the observed velocity range in emission. The extreme rotational velocities of the nuclear maser emission in NGC 4258 shows what might be happening in the centre of many starburst galaxies (see Section 4.3).
A more detailed discussion of the two cases is given by Koribalski, Dickey & Mebold (1993). In several galaxies both high rotational velocities and either infall or outflow of gas are observed.
3 HI absorption studies are used in many other areas of astronomy, e.g., in Galactic work to determine distances for pulsars, HII regions, supernova remnants, etc., and spin temperatures of the interstellar medium (ISM). In extragalactic astronomy, HI and Lyman α absorption line measurements against bright quasars can help to uncover the amount and properties of the gas in the line of sight, often out to very large distances corresponding to the early stages of galaxy evolution. Back.