


From here I will refer to the BLRGs with a peak at 25 µm as the peaker sample, and the comparison sample as the non-peaker sample. For both samples literature data were studied from X-ray, optical, infrared and radio observations, with different observational techniques (imaging, photometry, spectroscopy and/or polarimetry). There are always objects lacking data, but in general there were no immediate differences to be found when comparing the average luminosities over this spectral range and the spectral shape. However, a closer comparison reveals that there is no evidence at all for a peak at 25 µm, as suggested by the name, it rather seems that these objects display a lack of 60 µm emission. This means there is less cold dust in 25 µm peakers than in non-peakers.
The 60 µm dust can either be heated directly by the AGN (Hes et al. 1995) or by stars; many star-burst galaxies have a peak in their SED at 60 µm (Calzetti et al. 2000). This leaves two options: either the peakers have weaker AGN, so the dust is not hot enough to radiate at 60 µm, or there is not enough dust in the host galaxy to detect it. The first option can be tested by comparing the 178 MHz power of the two samples. Since the 178 MHz emission is isotropic, thus independent on the amount of dust in the host galaxy and the orientation of the object, the 178 MHz power should be significantly weaker for peakers. This is not confirmed in this sample.
The second option can be tested by comparing optical images. Data from the HST snapshot survey of the 3CR sample (de Koff et al. 1996) were used to compare the optical appearance of the two samples (see also Fig. 2). A blind test was done with three people to classify the galaxies as non-interacting/dust-free, interacting/dust-rich or unclear. It turned out that there is a good relation between the distortion of the host (including dust lanes) and the shape of the infrared SED. The peakers are predominantly normal, dust-free elliptical galaxies, and often reside in sparse environments. The non-peakers, however, display dust lanes (as seen in Centaurus A) and other typical signs of interaction. The dust is usually extended and often perpendicular to the radio axis, which excludes the AGN as being the dominant heating source.
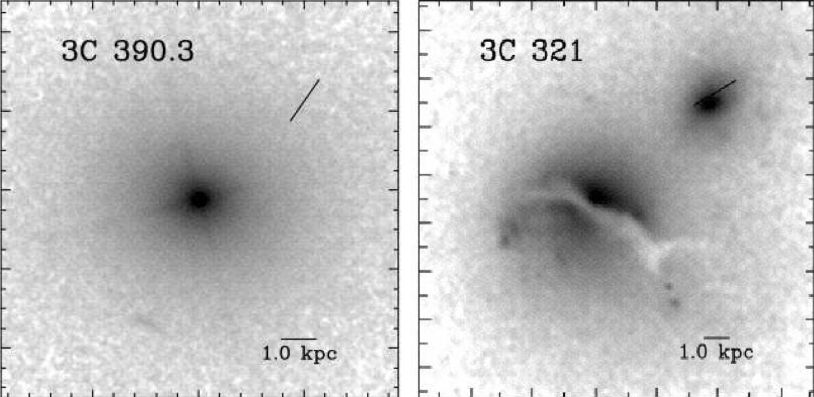 |
Figure 2. Optical HST images of 3C 390.3 and 3C 321. The black lines indicate the radio axis and the image scale (de Koff et al. 1996). |