


2.2 Line Variability
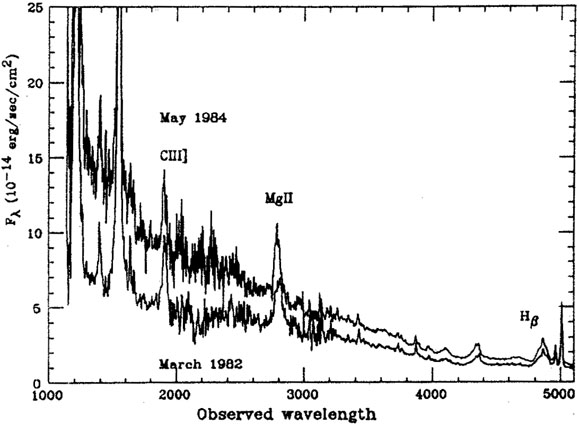
Given enough time, all broad-line AGNs show continuum variability. Spectrophotometric observations, obtained in the last decade, show variable broad emission lines in most, perhaps all Seyfert 1 galaxies. Some quasars show variable emission lines too but there are very few, if any, systematic observations of this kind. Fig. 3 shows the variable lines and continuum of NGC 5548, a typical Seyfert 1 galaxy.
|
Figure 3. The spectrum of the Seyfert 1 galaxy NCC 5548 at two epochs separated by 26 months, showing the large variation that occurred in the line and continuum luminosities (data from Wamsteker et al 1990). |
The observed line and continuum variability in Seyfert galaxies are clearly correlated. The emission lines respond to the continuum variability after a certain lag (which seems to be longer in more luminous objects). Assuming that the observed line variability is driven by changes in the continuum luminosity, the emission line light curve depends on the gas distribution in the nucleus and the continuum light curve. The study of the correlated line and continuum variability is thus an important tool for investigating the gas distribution in the nucleus. This is the subject of chapter 8.
Except perhaps for one case, there is no evidence for narrow line variability in AGNs. The gas emitting the narrow lines is therefore more extended and its distribution must be studied by other means.