


Several clusters of galaxies, including those observed by
Baum (1962),
are obvious
candidates to begin with. One of these is Cl (0024+1654) which is shown
by Zwicky (1959).
The southernmost (lowest) galaxy of the three galaxies which
form a small
isosceles triangle at the center of the cluster was observed with an
aperture of 7" diameter.
The bandpass below 5800 Å was 80 Å, and above 5800 Å it was 160
Å. The whole
spectrum was covered at these bandpasses. Measurements were made with
the galaxy first
in one aperture, then in the second one, and the results averaged. Five
completely
separate sets of measurements were made; the last one was not used
because of deteriorating
seeing conditions. The total observing time was 3 hours. All
measurements were reduced to absolute fluxes by standard techniques
(Oke 1965)
and are based on the absolute
calibration of  Lyr given by
Oke and Schild (1970).
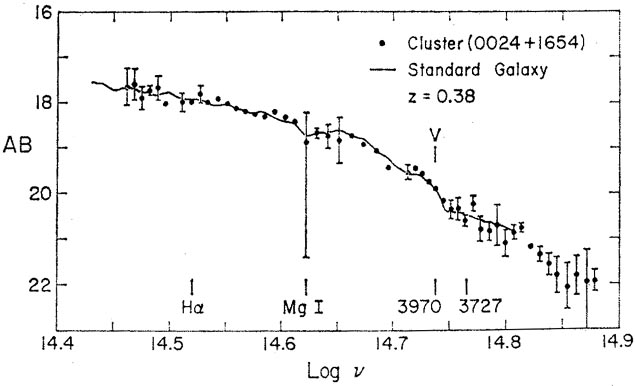
The results are shown as dots in
Figure 1 where AB = -2.5
logf
Lyr given by
Oke and Schild (1970).
The results are shown as dots in
Figure 1 where AB = -2.5
logf (ergs s-1
cm-2 Hz-1) -48.60 is plotted against
log ,
where is the observed frequency. The
center of the visual passband is marked V. The
corresponding visual magnitude is V = 19.9. Standard deviations
were calculated by
comparing the four individual sets of measures and are shown if greater
than 0.10 mag.
The accuracy of one point relative to another is probably somewhat
higher than shown,
since colors are more accurate than magnitude measurements. The
observations made
below 3900 Å have such large errors that they are not plotted.
(ergs s-1
cm-2 Hz-1) -48.60 is plotted against
log ,
where is the observed frequency. The
center of the visual passband is marked V. The
corresponding visual magnitude is V = 19.9. Standard deviations
were calculated by
comparing the four individual sets of measures and are shown if greater
than 0.10 mag.
The accuracy of one point relative to another is probably somewhat
higher than shown,
since colors are more accurate than magnitude measurements. The
observations made
below 3900 Å have such large errors that they are not plotted.
|
Figure 1. Absolute spectral energy
distribution for a galaxy in Cl (0024+1654). AB = -2.5
logf |
The redshift was determined by superposing the absolute spectral energy
distribution
of the total light from nearby giant elliptical galaxies
(Schild and Oke 1971) and
that of the cluster galaxy and shifting one with respect to the other
until a fit was
obtained. The result is z = 0.38 ± 0.01; no other redshift
value is feasible. The "standard
galaxy" is shown by the solid line. Several spectral features are marked
in Figure 1.
There is evidence that the emission line
 3727 of [O II] is present,
but there is no evidence for emission in
H or
5007 of [O III].
3727 of [O II] is present,
but there is no evidence for emission in
H or
5007 of [O III].
A second cluster of particular interest is that around
3C 295. It was
decided to
observe 3C 295 itself, since something was already known
about its spectrum
(Minkowski 1960).
On the other hand, there was the possibility that the galaxy
energy distribution
might be quite abnormal. Observations were made in the same was as for
Cl (0024+1654).
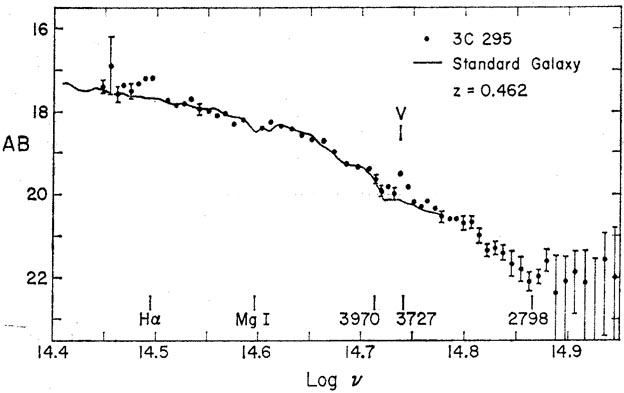
The total observing time was 8 hours. Again an aperture of 7" was used. The
results are shown in Figure 2; again
standard-deviation bars are shown if greater than
0.10 mag. The corresponding visual magnitude is V = 19.9. Fitting
the energy distribution of standard giant elliptical galaxies gave
z = 0.46 ± 0.01, in excellent agreement
with Minkowski's result of z = 0.462. The [O II] line at
3727
is clearly present. H at
an observed wavelength of 9600 Å may be present in emission; it is just
to the red of
strong absorption bands of water vapor. The [O III] lines
5007 may be
present since
the flux in the band at log = 14.611
is higher than that for the standard galaxy.
|
Figure 2. Same as
Fig. 1 but for the radio galaxy 3C 295. The
observations are not sufficiently accurate
to determine if the Mg II doublet near
|
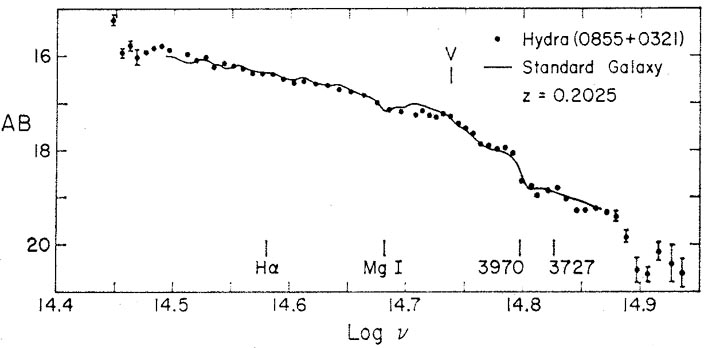
Results are shown in Figure 3 for galaxies 8 + 9 in the Hydra cluster (0855+0321). These galaxies are marked on Plate 1 by Humason et al. (1956). In this object the aperture size and bandpasses were the same as in the previous objects. Total observing time was 4 hours. The visual magnitude is V = 17.3. The value of z from the spectrometer data is 0.20 ± 0.01 in agreement with z = 0.2025 given by Humason et al. (1956).
|
Figure 3. Same as Fig. 1 but for galaxies 8 + 9 in the Hydra cluster |