


Let us now to turn to the question of concordance between the BBN
predictions and the observations discussed above. This is best
summarized in a comparison of likelihood functions as a function of the
one free parameter of BBN, namely the baryon-to-photon ratio
 . By combining the
theoretical predictions (and their uncertainties) with the
observationally determined
abundances discussed above, we can produce individual likelihood
functions
[7]
which are shown in Figure 9.
A range of primordial 7Li values are chosen
based on the the abundances in Eqs. (7) and (8) as well as a higher and
lower value. The double peaked nature of the
7Li likelihood functions is due to the presence of a minimum in the
predicted lithium abundance in the expected range for
. For a given observed
value of 7Li, there are two likely values of
. As the lithium
abundance is lowered, one tends toward the minimum of the BBN
prediction, and the two peaks merge.
Also shown are both values of the primordial 4He abundances
discussed above.
As one can see, at this level there is clearly concordance between
4He, 7Li and BBN.
. By combining the
theoretical predictions (and their uncertainties) with the
observationally determined
abundances discussed above, we can produce individual likelihood
functions
[7]
which are shown in Figure 9.
A range of primordial 7Li values are chosen
based on the the abundances in Eqs. (7) and (8) as well as a higher and
lower value. The double peaked nature of the
7Li likelihood functions is due to the presence of a minimum in the
predicted lithium abundance in the expected range for
. For a given observed
value of 7Li, there are two likely values of
. As the lithium
abundance is lowered, one tends toward the minimum of the BBN
prediction, and the two peaks merge.
Also shown are both values of the primordial 4He abundances
discussed above.
As one can see, at this level there is clearly concordance between
4He, 7Li and BBN.

|
Figure 9. Likelihood distributions for four values of primordial 7Li/H (1010 x 7Li = 1.9 (dashed), 1.6 (dotted), 1.23 (solid), and 0.9 (dash-dotted)), and for 4He (shaded) for which we adopt YP = 0.238 ± 0.005 (Eq. (1)). Also shown by the long dashed curve is the likelihood function based on the 4He abundance from Eq. (2). |
The combined likelihood, for fitting both elements simultaneously,
is given by the product of two of the functions in
Figure 9.
The combined likelihood is shown in Figure 10,
for the two primordial values
of 7Li in Eqs. (7) and (8). For
7LiP = 1.6 x 10⁻¹⁰ (shown as the
dashed curve), the 95% CL region covers
the range 1.55 <
10 < 4.45,
with the two peaks occurring at
10 = 1.9
and 3.5. This range corresponds to values of
 B between
For 7LiP = 1.23 x 10⁻¹⁰ (shown as the
solid curve), the 95% CL region covers the range
1.75 <
Figure 10. Combined likelihood distributions
for two values of primordial 7Li/H
(1010 x 7Li = 1.6 (dashed), 1.23
(solid)), and 4He with YP = 0.238
± 0.005 ± 0.005 (Eq. (1)).
When deuterium is folded into the mix, the situation becomes more complicated.
Although there are several good measurements of deuterium in quasar
absorption systems
[26],
and many of them giving a low value of D/H
Figure 11. Likelihood distributions for two
values of primordial 7Li/H
(1010 x 7Li = 1.6 (dashed) and 1.23
(solid)), and 4He with YP = 0.238
± 0.002 ± 0.005 from Eq. (1) (shaded) and
YP = 0.244 ± 0.002 ± 0.005 from Eq.
(2) (long dashed). Also shown are the two likelihood functions for
high and low D/H as marked.
Because there are no known astrophysical sites for the production of
deuterium, all observed D is assumed to be primordial. As a result,
any firm determination of a deuterium abundance establishes an upper bound
on
It is interesting to
compare the results from the likelihood functions of 4He and
7Li with that of D/H. This comparison is shown in
Figure 11.
Using the higher value of D/H = (2.0 ± 0.5), we would find
excellent agreement between 4He, 7Li and D/H. The
predicted range for
with the peak likelihood value at
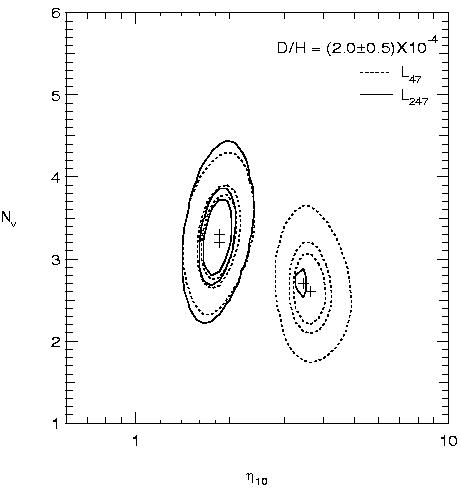
Figure 12. 50%, 68% & 95% C.L. contours of
L47 and
L247 where observed abundances are given by
eqs. (1 and 7), and high D/H.
If instead, we assume that the low value
of D/H = (3.4 ± 0.3) x 10-5
[27]
is the primordial abundance,
there is hardly any overlap between the D and 7Li,
particularly for the
lower value of 7Li from eq. (8). There is also very limited overlap
between D/H
and 4He, though because of the flatness of the 4He
abundance with respect to
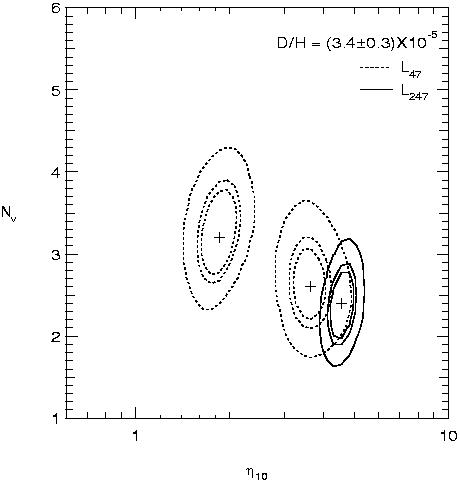
Figure 13. 50%, 68% & 95% C.L. contours of
L47 and
L247 where observed abundances are given by
eqs. (1 and 7), and low D/H.
It is important to recall however, that the true uncertainty in the low
D/H systems might be somewhat larger. Mesoturbulence effects
[30]
allow D/H to be as large as 5 x 10⁻⁵. In this case, the peak
of the D/H likelihood function shifts down to
We can obtain still more information regarding the compatibility of the
observed
abundance and BBN by considering generalized likelihood functions where
we allow
N
Note however that the ranges in
With high D/H, L247
peaks at N
Note that within the 95% CL range, there is also a small area
with
Similarly, for low D/H, L247
peaks at N
Acknowledgments
This work was supported in part by
DoE grant DE-FG02-94ER-40823 at the University of Minnesota.
 10
< 3.90. In this case, the primordial value is low enough that the
two lithium peaks are more or less merged as is the total likelihood function
giving one broad peak centered at
10
10
< 3.90. In this case, the primordial value is low enough that the
two lithium peaks are more or less merged as is the total likelihood function
giving one broad peak centered at
10
 2.5. The corresponding
values of B in this
case are between
2.5. The corresponding
values of B in this
case are between

(3.4 ± 0.3) x
10-5
[27],
there remains an observation with D/H nearly an order of magnitude
higher D/H (2.0 ± 0.5) x
10-4
[28].

which is robust.
Thus the ISM measurements
[29]
of D/H = 1.6 x 10⁻⁵ imply an upper bound
10 < 9.
now becomes
 10 = 2.1,
4He and 7Li abundances from
eqs. (1) and (8) respectively. This corresponds to
Bh2 =
0.008+.004-.002.
The higher 7Li abundance of eq. (7) drops the peak value down
slightly
to 10 =
1.8 and broadens the range to 1.5 - 3.4.
The higher 4He abundance shifts the peak and range (relative
to eq. (12))
up to 2.2 and 1.7 - 3.5.
10 = 2.1,
4He and 7Li abundances from
eqs. (1) and (8) respectively. This corresponds to
Bh2 =
0.008+.004-.002.
The higher 7Li abundance of eq. (7) drops the peak value down
slightly
to 10 =
1.8 and broadens the range to 1.5 - 3.4.
The higher 4He abundance shifts the peak and range (relative
to eq. (12))
up to 2.2 and 1.7 - 3.5.
, as one can see, the
likelihood function for the larger value of 4He
from eq. (2) is very broad. In this case, D/H is just compatible (at
the 2 level) with the other
light elements, and the peak of the likelihood function
occurs at roughly
10 = 4.8
and with a range of 4.2 - 5.6.
level) with the other
light elements, and the peak of the likelihood function
occurs at roughly
10 = 4.8
and with a range of 4.2 - 5.6.
10
4, and there would be a near
perfect overlap
with the high
7Li peak and since the 4He distribution function
is very broad, this would be a highly compatible solution.
 to vary as well
[7,
31,
32,
4].
The likelihood functions now become functions of two parameters
to vary as well
[7,
31,
32,
4].
The likelihood functions now become functions of two parameters
 ( , N) .
The peaks of the distribution as
well as the allowed ranges of
and
N are
easily discerned in the
contour plots of Figures 12 and
13 which show
the 50%, 68% and 95% confidence level contours in L47 and
L247 projected onto the
-N plane, for high and low D/H as
indicated. L47 corresponds to the likelihood function
based on 4He and 7Li
only, whereas L247 includes D/H as well. The crosses
show the location of the
peaks of the likelihood functions.
L47 peaks at
N = 3.2,
10 = 1.85
and at N = 2.6,
10 = 3.6.
The 95% confidence level allows the following ranges
in and
N
( , N) .
The peaks of the distribution as
well as the allowed ranges of
and
N are
easily discerned in the
contour plots of Figures 12 and
13 which show
the 50%, 68% and 95% confidence level contours in L47 and
L247 projected onto the
-N plane, for high and low D/H as
indicated. L47 corresponds to the likelihood function
based on 4He and 7Li
only, whereas L247 includes D/H as well. The crosses
show the location of the
peaks of the likelihood functions.
L47 peaks at
N = 3.2,
10 = 1.85
and at N = 2.6,
10 = 3.6.
The 95% confidence level allows the following ranges
in and
N
 and
N are strongly
correlated as is evident in Figure 12.
, and
also at 10
= 1.85. In this case the 95% contour gives the ranges
and
N are strongly
correlated as is evident in Figure 12.
, and
also at 10
= 1.85. In this case the 95% contour gives the ranges
 10 =
3.2-3.5 and N = 2.5-2.9.
= 2.4,
and 10 = 4.55.
The 95% CL upper limit is now
N < 3.2, and the
range for is
3.9 < 10 < 5.4.
It is important to stress that these abundances
are now consistent with the standard model value of
N = 3 at the
2 level.
10 =
3.2-3.5 and N = 2.5-2.9.
= 2.4,
and 10 = 4.55.
The 95% CL upper limit is now
N < 3.2, and the
range for is
3.9 < 10 < 5.4.
It is important to stress that these abundances
are now consistent with the standard model value of
N = 3 at the
2 level.