


Finally, for a line of argument that turns out to lead in completely the
opposite
direction - i.e. to galaxy formation at rather high redshift -
we turn to the stellar
populations in high-redshift radio galaxies. Most of the 1980s
constitute a vanished age of
innocence for the radio cosmologists: at this time, they were the only
ones able to find
galaxies at z  1
in any sort of numbers. A series of investigations established several
interesting properties for these objects, in particular
1
in any sort of numbers. A series of investigations established several
interesting properties for these objects, in particular
 1
(Lilly & Longair
1984).
1
(Lilly & Longair
1984).
6 - an inference of
enormous importance for models of galaxy formation.
However, over the last few years a revisionist tendency has appeared -
leading to
all the above achievements being questioned. Even at the time, there was
some doubt
whether we could be sure that the above behavior was representative of
all galaxies.
Fears of a radio-induced bias appeared well founded with the discovery
of what has
become known as the `alignment effect': the realization that at large
redshifts (z 0.8)
the optical and radio axes of many of the most powerful radio galaxies
are aligned
(McCarthy et al. 1987;
Chambers, Miley &
van Breugel 1987).
Near-IR images of 3CR
galaxies appeared to confirm that the infrared morphologies of these
objects were in general just as peculiar as their optical morphologies
(Chambers, Miley &
Joyce 1988;
Eisenhardt &
Chokshi 1990;
Eales & Rawlings
1990).
These discoveries provide direct
evidence of radio-induced `pollution' of the UV-optical light of radio
galaxies, and this
led some authors to suggest that these sources are thus useless as
probes of galaxy evolution in general (e.g.
Eisenhardt &
Chokshi 1990).
Furthermore, it has become apparent that Lilly's galaxy 0902+34 does not have
the properties initially claimed. The K flux is rather lower than
Lilly's measurement,
and a large fraction of this smaller total is contributed by the [OII]
3727Å line, which
is redshifted into the K window. The result is that the galaxy in
fact looks very young:
nearly flat-spectrum with no evidence for the presence of an old
component. On this
basis, and considering other similar objects at extreme redshifts,
Eales et al. (1993)
have argued that radio galaxies at z
2 are in effect
protogalaxies observed in the process of formation.
Before accepting this remarkable reversal of conventional wisdom, however, it is worth bearing in mind that the galaxies under discussion are among the most luminous few dozen radio AGN in the entire universe (inevitably: they are the high-redshift members of bright samples with S ~ 1-10 Jy). In order to draw any general conclusions about galaxy formation, it is necessary to understand the effect the AGN has on the optical/IR properties of the galaxy within which it is embedded.
6.2 Alignments as a function of power
What is required is to be able to study the properties of galaxies with
a wide range
of radio powers, and this is what James Dunlop & I have attempted in
some recent work
(Dunlop & Peacock
1993).
In order to eliminate possible confusion with any
epoch dependence, we worked with a redshift band around z
1. At this redshift, it
is relatively easy to select samples unbiased by optical selection, and
the objects are
bright enough that high-quality data can be obtained. We considered
galaxies from
two catalogues: 19 high-power 3CR galaxies; 14 low-power comparison
galaxies with
S2.7 GHz > 0.1 Jy from the Parkes Selected Regions
(PSR)
(Downes et al. 1986;
Dunlop et al. 1989a).
The PSR galaxies are a factor
20 less radio luminous than their 3CR
counterparts. Radio luminosity is the only significant difference
between the radio properties of the two samples.
Our principal dataset on these galaxies is deep infrared images, taken with the
62 x 58 pixel InSb array camera IRCAM, on the 3.9m United Kingdom
Infrared Telescope
(UKIRT), with the camera operating in the 0.62-arcsec/pixel mode. From these
images, we investigated the extent of the alignment effect at z
1. To avoid
subjective factors, the infrared position angles were determined
automatically by using the
moments of the sky-subtracted flux within some circular aperture. We
decided to vary
the diameter of the aperture to adapt to the size of the radio source,
because there are
virtually no examples of optical or IR emission extending beyond the
radio lobes. If the
diameter of the radio source lay between 5 and 8 arcsec, an aperture
equal in diameter
to the radio source was used. If the radio source was greater than 8
arcsec in diameter,
an 8 arcsec diameter was used (larger apertures generally contain
foreground objects).
If the radio source was smaller than 5 arcsec in diameter, a 5-arcsec
diameter was used.
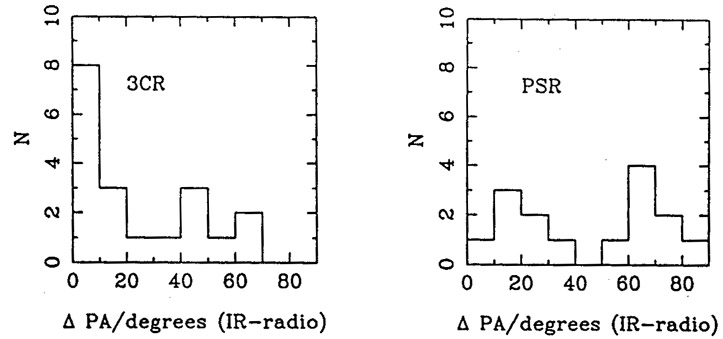
Figure 5 shows the resulting IR-radio alignment histogram for the 3CR and PSR subsamples. The infrared alignment effect is extremely obvious in our data for the 3CR galaxies, which appears to contrast with the conclusions of Rigler et al. (1992). Much of the apparent discrepancy arises from the fact that we have a larger sample. Position angles for objects in common generally agree well, but with some exceptions which are due to different methods of analysis; Rigler et al. (1992) sometimes use a large aperture where their position angle is affected by companion objects. In contrast to the 3CR sub-sample, there is no evidence of any significant alignment between the infrared and radio morphologies of the PSR galaxies. This result is very robust and quite obvious given the images: the PSR galaxies are rounder, with generally little sign of the disturbance evident in many of the 3CR images.
|
Figure 5. Histograms of (IR-Radio) position angle differences for the 3CR and PSR samples. The clear difference seen here is completely robust to different methods for determining position angles. It is related to the fact that the PSR galaxies are also rounder, and generally lacking in an extended aligned component of blue light. |
This argues in favor of the two-component model advanced by
Lilly (1989) and
Rigler et al. (1992).
In this, the underlying galaxy is round, but there is a component
of variable amplitude which is elongated along the radio axis, and it is
this which leads
to the alignment. Our data demonstrate that the strength of this
component correlates
well with radio power, as is perhaps not so surprising in
retrospect. Certainly, several
models for the production of this light exist that predict a correlation
with radio power
(scattering, induced star formation, inverse Compton emission - see e.g.
Daly 1992
for a review). We shall not be concerned here with having to plump for
a specific model,
but it is worth noting that evidence is starting to mount in favor of
the explanation
in terms of scattering from a hidden blazar. The main argument in this
direction is
the measurement of polarization with B-vector perpendicular to the radio
axis. The
first measurements of this effect gave very low percentage
polarizations, implying that
this could not be the dominant mechanism. However, with better
resolution, imaging
polarimetry is now producing polarized fractions of
20% in the outer parts
of strongly aligned galaxies
(Jannuzi & Elston
1991;
Tadhunter et al. 1992;
Cimatti et al. 1993).
Given geometrical dilution, it now seems plausible that the aligned
component results from scattering in at least some objects.
6.3 Colors and ages of radio galaxies
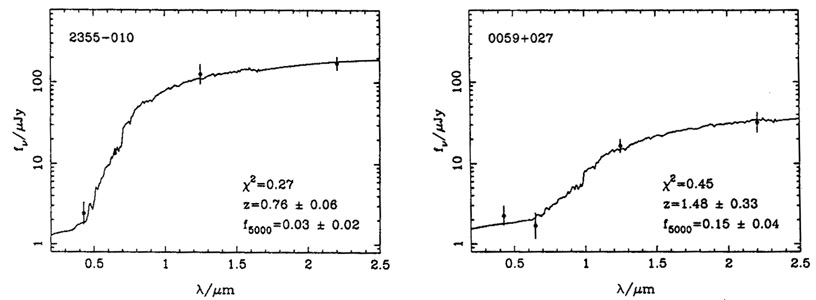
Having seen that the extent of the aligned component scales so dramatically with radio power, we now look for other optical/infrared properties which correlate with power. Given that the aligned component is often bluer than the nucleus of the galaxy, we should certainly expect to see some correlation between color and power. A useful way of quantifying the degree of UV activity was introduced by Lilly (1989). He assumes that the observed spectrum of a radio galaxy arises from a combination of two distinct components - an `old' population with a well-developed 4000Å break, and a `young' flat-spectrum component. This simple model can be fitted to the observed colors by varying one parameter. This is f5000: the fractional contribution of the flat-spectrum component to the galaxy light at a rest wavelength of 5000Å. This method can also be used with some success to estimate the redshift for objects which lack spectroscopy (see Lilly 1989; Dunlop & Peacock 1993). Some of the PSR objects had their redshifts estimated in exactly this way: the redder objects with low f5000 also have low levels of emission-line activity and so are of course the hardest spectroscopic targets.
This procedure is illustrated in Figure 6. For
the `old' or `red' component we chose
to adopt a spectrum capable of producing the reddest colors seen in
radio galaxies
at z 1 (e.g.
3C65); in practice this was achieved using the
spectrum produced by a
stellar population of age 10 Gyr in an updated version of the models of
Guiderdoni &
Rocca-Volmerange (1987).
For the `young' or `blue' component, we decided to adopt a
power-law spectrum (f
 -
- ) with a spectral index
= 0.2. This choice of spectrum
can be justified at two different levels. First, the exact value of
was chosen in the
spirit of scattered quasar light;
Barvainis (1990)
concluded that the mean value for
the optical spectral index in high luminosity quasars (i.e. those
whose optical spectra
are essentially uncontaminated by a host galaxy contribution) is
= 0.2. Second,
empirically, this form of spectrum is an excellent representation of the
approximately
flat f optical-UV
continuum actually observed in high-redshift radio galaxies.
) with a spectral index
= 0.2. This choice of spectrum
can be justified at two different levels. First, the exact value of
was chosen in the
spirit of scattered quasar light;
Barvainis (1990)
concluded that the mean value for
the optical spectral index in high luminosity quasars (i.e. those
whose optical spectra
are essentially uncontaminated by a host galaxy contribution) is
= 0.2. Second,
empirically, this form of spectrum is an excellent representation of the
approximately
flat f optical-UV
continuum actually observed in high-redshift radio galaxies.
|
Figure 6. Two examples of the spectral
fitting used to determine estimated redshifts
and f5000, the relative contribution of the
flat-spectrum component. The `red' component
is the spectrum produced by a 1-Gyr `Burst' model of galaxy evolution
at an age
of 10 Gyr. The blue component is a power-law with spectral index
|
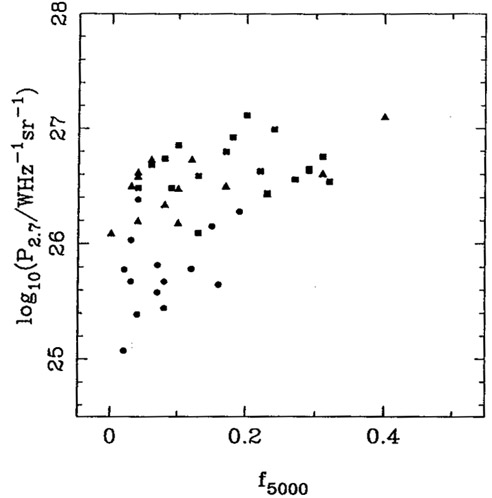
In Figure 7 we show the quantitative relation between this definition of UV activity and radio power. Radio power and f5000 appear to be strongly correlated (no PSR galaxy has f5000 > 0.19 whereas more than half the 3CR galaxies have f5000 > 0.20). This result contrasts sharply with that of Lilly (1989), who reported that in his combined 3CR and 1-Jy sample there was no significant correlation between f5000 and P408 MHz. The origin of the difference appears to be an error in Lilly's calculation of radio luminosity. An interesting aspect of the relation with power is that all sub-samples appear to possess a range of f5000 values, but with power apparently setting the upper limit in f5000. This suggests the existence of a second parameter which determines the actual level of UV light - see Dunlop & Peacock (1993) for further discussion.
|
Figure 7. Radio power, P2.7 GHz, versus f5000 for the combined 46-source 3CR / 1-Jy / PSR sample. 3CR sources are shown as squares, 1-Jy sources as triangles, and the PSR sources as circles. Notice that the correlation is mainly in the sense of setting an upper limit to f5000 at given power. |
For the present, the point to emphasize is that this diagram provides a
quantitative
definition of a radio-quiet galaxy. At least at z
1, any galaxy with
P2.7  1025.5 WHz-1sr-1 (for h = 1/2)
has a negligibly small level of UV activity. There
have been some suggestions that UV activity and alignments are functions
specifically
of redshift, but there is little evidence that this is anything other
than a reflection of the
above trend in a flux-limited sample. Until proven otherwise, the
natural null hypothesis
is that galaxies below this power level at higher redshifts also reflect
the properties of the general population of massive ellipticals.
1025.5 WHz-1sr-1 (for h = 1/2)
has a negligibly small level of UV activity. There
have been some suggestions that UV activity and alignments are functions
specifically
of redshift, but there is little evidence that this is anything other
than a reflection of the
above trend in a flux-limited sample. Until proven otherwise, the
natural null hypothesis
is that galaxies below this power level at higher redshifts also reflect
the properties of the general population of massive ellipticals.
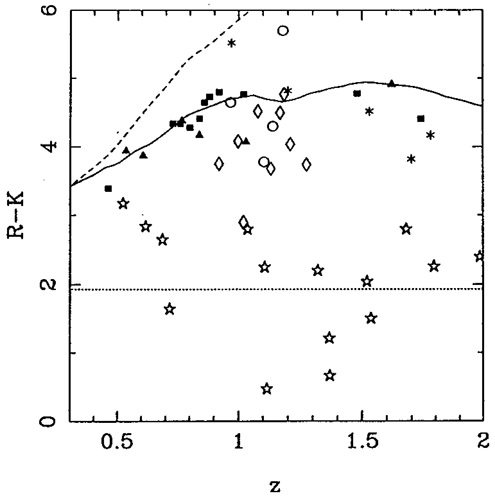
In Figure 8 we compare the R - K colors of the PSR and 3CR galaxies. Several other objects which are not part of our PSR and 3CR subsamples have been included here for comparison purposes. These are (i) the very red 3CR galaxy 3C65, (ii) the five 1-Jy galaxies with measured redshifts for which r - K colors are given by Lilly (1989), and (iii) all spectroscopically confirmed quasars with 0.5 < z < 2.0 in the Parkes Selected Regions sample for which R - K colors exist (Dunlop et al. 1989a).
|
Figure 8. Comparison of the R - K colors of
the PSR galaxies (solid squares and
triangles) and the 3CR galaxies in the subsample (open circles and
diamonds). PSR
galaxies with measured redshifts are denoted by solid triangles, those
with estimated
redshifts by solid squares. 3CR galaxies whose K-band morphologies are
aligned with
15° of the radio axis are denoted by diamonds, and the remainder
by open circles. Also shown are five 1-Jy galaxies (from
Lilly 1989)
(asterisks), and all spectroscopically
confirmed quasars with 0.5 < z < 2.0 in the PSR sample
(stars). The dashed line
shows the effect of simply k-correcting the spectrum. The solid line
shows a very old (zf = 50,
|
This diagram displays a number of important features. First, with the obvious
exception of 3C65, the PSR galaxies are consistently redder than the 3CR
galaxies;
moreover, the PSR galaxies display remarkably little dispersion in their
optical-infrared colors. This is well consistent with the findings of
Rixon, Wall & Benn
(1991)
at lower redshift: they found the rest-frame colors of radio ellipticals
at z < 0.3 to be
constant to within a few hundredths of a magnitude. In contrast, the 3CR
galaxies
scatter downwards from the well-defined PSR locus towards the region of
color space
occupied by the PSR quasars (the very red galaxies 3C65 and 1129+37
appear to be
exceptional). Of the six 3CR galaxies with R - K
 4.0, all but one (3C252) have
K-band morphologies clearly aligned with their radio axes.
4.0, all but one (3C252) have
K-band morphologies clearly aligned with their radio axes.
The homogeneity of the PSR galaxies, along with the lack of any dramatic
alignment
effect in the redder galaxies, suggests instead that the true
optical-infrared color of a
radio-quiet elliptical at z
1 is actually R - K
4.8. Values of
f5000 0.05
might be a feature of most elliptical galaxies at z
1. This is certainly
consistent with the results
of Aragón-Salamanca et al. (1993).
From optical/IR photometry of clusters of galaxies
up to z = 0.8, they conclude that ellipticals (mainly
radio-quiet) in the highest-redshift
clusters are slightly bluer than present-day ellipticals. On the
assumption that these
galaxies formed in a single burst, their data allow the epoch of
formation to be as low as
z = 2. However, the radio-selected samples extend the range still
further. Although the
above discussion has concentrated on the situation at z
1, the PSR sample contains a
number of galaxies inferred from color-estimated redshifts and from the
K-z relation
to have z 2. These also
are apparently old and red, with R - K
4 - 5. If this
is taken to imply a minimum age of 1h-1 Gyr, the
formation redshift is pushed out to between 3.3 and 7.2, depending on
 . Note that this is the epoch
at which the
whole galaxy must be assembled: ellipticals cannot have been assembled
from many small clumps after star formation had ceased
(Bower, Lucey &
Ellis 1992).
It will be
fascinating to pursue this line of argument in mJy samples, where we may
hope to find
`normal' radio galaxies at z > 3. If these are still red, the
consequences for galaxy formation models will be radical indeed.
. Note that this is the epoch
at which the
whole galaxy must be assembled: ellipticals cannot have been assembled
from many small clumps after star formation had ceased
(Bower, Lucey &
Ellis 1992).
It will be
fascinating to pursue this line of argument in mJy samples, where we may
hope to find
`normal' radio galaxies at z > 3. If these are still red, the
consequences for galaxy formation models will be radical indeed.