

To test further if the faint-end slope of the luminosity function depends on environmental richness, we began surveys in 1980 of the Fornax cluster and of low density groups. In the strong version of the biased galaxy formation model the dwarf to giant ratio should be a function of density (Kaiser 1986, Bardeen 1986, Dekel and Silk 1986). The prediction from the model is that the dwarf/giant ratio should be larger in low density regions than in clusters, opposite to the result in Figure 10 which shows the faint-end slope to be steeper in the cluster than in the field. In this and in the following section we generalize the result by adding data for sparse clusters and loose groups and for the "general field" from several new surveys.
Ferguson (1989) has analyzed the du Pont plate material for the Fornax cluster and has combined it with similar data for the loose groups of Leo, Dorado, NGC 1400, NGC 5044, and Antlia. He has constructed maps of the surface distributions of the various types of galaxies in each of these aggregates, and has made catalogs of the groups similar to the Virgo cluster catalog. The Fornax cluster catalog (Ferguson 1989) and the luminosity function (Ferguson and Sandage 1988) based on it have been published.
Our principal conclusion is that the luminosity functions of Fornax and Virgo are indistinguishable. A large population of dE early type dwarfs is present in Fornax, as was known to Hodge (1959, 1960), Reaves (1964), and to Hodge, Pyper, and Webb (1965) who began a catalog. Our result that the dwarf to giant ratio in Fornax is statistically the same as in Virgo is contrary to the conclusion of Caldwell (1987) who wrote that a significant difference exists between the clusters, Fornax having fewer dwarfs per giant. However, Ferguson (1989) shows that Caldwell's catalog is incomplete in its faint dwarf listings due to the nature of his plate material found by comparing his data with those obtained with the large scale du Pont reflector plates.
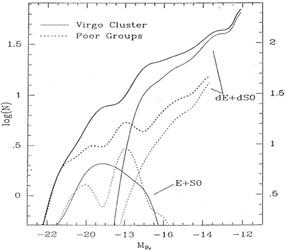
However, the situation is different in the looser groups where a significant difference does exist in the faint-end slopes compared with Virgo + Fornax + Antlia, in agreement with the result in Figure 10. The dwarf to giant ratio is larger in rich regions than in sparse environments as shown in Figure 11. Here, the type - specific luminosity function of giant E + S0 galaxies is added to that for the dwarf dE + dS0 types for the Virgo cluster alone, and the sum is compared with similar data for poorer groups (Leo + Dorado + NGC 1400 + NGC 5044). The heavy solid line for the Virgo cluster has a steeper faint - end slope than the heavy dashed line for the poor groups, both being normalized to the same total number of E and S0 galaxies. The sense of the difference in Figure 11 is that the number of dwarfs per giant is smaller in the poor groups, which, as in Figure 10, is again opposite to the predicted effect for biased galaxy formation.

|
Figure 11. Comparison of the E + S0 + dE + dS0 LFs for the Virgo cluster and for a composite (summed data) of poor groups discussed in the text. Diagram from Ferguson and Sandage (in preparation). |