Copyright © 1988 by Annual Reviews. All rights reserved
| Annu. Rev. Astron. Astrophys. 1988. 26:
631-86 Copyright © 1988 by Annual Reviews. All rights reserved |


The study of large-scale structure is an attempt to unravel the
skeleton of our universe. We try to discover how matter, or at least
the luminous matter observed in the form of galaxies and clusters of
galaxies, is distributed in space. Early observations suggested that
while galaxies show a tendency to cluster into groups and rich
clusters on small scales
( 20h-1 Mpc), as expressed statistically by
the galaxy correlation function, most of the luminous matter in the
Universe is distributed randomly on large scales
(
20h-1 Mpc), as expressed statistically by
the galaxy correlation function, most of the luminous matter in the
Universe is distributed randomly on large scales
( 20h-1 Mpc). This
picture of a relatively "smooth" universal skeleton has been changing
quickly and drastically in recent years as new observational data have
begun revealing a universe with extensive structure and motion on very
large scales of ~ 100h-1 Mpc or more. The new data on the
large-scale
structure have led to major changes in existing theoretical ideas on
how galaxies and large-scale structure might have been formed. Several
previous models have proven inadequate to explain the new
observations, while some new candidate models (e.g. cold dark matter,
explosions, cosmic strings) have been suggested and worked out in
various degrees of detail. Still, despite the great effort and many
ingenious ideas, no single theory for the formation of galaxies and
large-scale structure can yet satisfactorily match all the
observations.
20h-1 Mpc). This
picture of a relatively "smooth" universal skeleton has been changing
quickly and drastically in recent years as new observational data have
begun revealing a universe with extensive structure and motion on very
large scales of ~ 100h-1 Mpc or more. The new data on the
large-scale
structure have led to major changes in existing theoretical ideas on
how galaxies and large-scale structure might have been formed. Several
previous models have proven inadequate to explain the new
observations, while some new candidate models (e.g. cold dark matter,
explosions, cosmic strings) have been suggested and worked out in
various degrees of detail. Still, despite the great effort and many
ingenious ideas, no single theory for the formation of galaxies and
large-scale structure can yet satisfactorily match all the
observations.
The reason that large-scale structure is fundamental to our understanding of the Universe is because the structure evolves very slowly with time. Even for typical velocities of ~ 103 km s-1, objects can move only ~ 10h-1 Mpc within the Hubble time. Therefore, large structures observed today are cosmic fossils of conditions that existed in the early Universe; these fossils record the history of galaxy and structure formation and evolution.
The cosmological principle states that the Universe is homogeneous and isotropic. Observations of galaxies and clusters, however, show inhomogeneities and structure on all scales studied so far. The Universe is clumped on the scales of galaxies (kiloparsecs), clusters (megaparsecs), and very large superclusters (tens of megaparsecs or more, comparable to the largest scale of current samples). When does the Universe become homogeneous? How does the clumpy distribution of the luminous matter fit with the highly isotropic distribution of the microwave background radiation on the largest scales? The answers are not yet known.
The classic method of investigating structure in the Universe is to observe the spatial distribution of galaxies. Extensive surveys of thousands of galaxy redshifts are needed in order to cover large enough volumes and scales. Galaxy redshift surveys have been carried out by several groups (see review papers by Oort 1983, Chincarini & Vettolani 1987, and Rood 1988; also Gregory & Thompson 1978 , Gregory et al. 1981, Davis et al. 1982; Giovanelli et al. 1986, de Lapparent et al. 1986, da Costa et al. 1988).
A different approach is emphasized in this review: using the high-density peaks of the galaxy distribution, i.e. the rich clusters of galaxies, as tracers of the large-scale structure. Much as the mountain peaks trace mountain chains on Earth, so too do the rich clusters, with their low space density - and large mean separation, serve as an efficient tracer of the largest scale structures. Recent results, summarized in this review, show that clusters do indeed provide an efficient and effective tracer of the large-scale structure of the Universe.
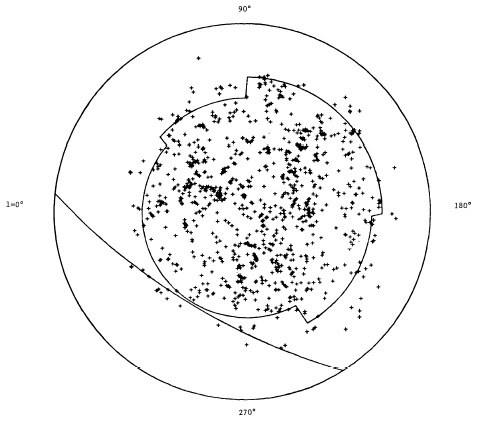
Galaxy and cluster maps of the Northern Hemisphere to
z 0.15 are
compared in Figures 1 and 2
[Shane & Wirtanen's
(1967)
galaxy map and
Abell's (1958)
rich cluster map, respectively]. The clumped
distribution is apparent in both maps. While ~ 106 galaxies
cover the
mapped volume, only ~ 500 rich clusters highlight the structure in the
same volume of space.

|
Figure 1. A map of the galaxy distribution in the Northern Hemisphere (to 19m) from the Shane & Wirtanen (1967) counts (Soneira & Peebles 1978). |
|
Figure 2. A map of Abell's cluster
distribution in the Northern Hemisphere to distance group D
|
The main observational data placing constraints on the large-scale structure are the following:
 cc(r), which, for Abell clusters
of richness
cc(r), which, for Abell clusters
of richness  1, is unity at
approximately 25h-1 Mpc and remains positive out to
~ 100h-1 Mpc (e.g.
Bahcall & Soneira
1983). Associated
velocities of ~ 103 km s-1 may also be suggested
(Bahcall et al. 1986).
1, is unity at
approximately 25h-1 Mpc and remains positive out to
~ 100h-1 Mpc (e.g.
Bahcall & Soneira
1983). Associated
velocities of ~ 103 km s-1 may also be suggested
(Bahcall et al. 1986).
 T / T, on
various angular scales (1° corresponding to
~ 100h-1 Mpc) (e.g.
Uson & Wilkinson
1984,
Davies et al. 1987,
Lasenby 1988,
Readhead 1988,
Strukov et al. 1988).
T / T, on
various angular scales (1° corresponding to
~ 100h-1 Mpc) (e.g.
Uson & Wilkinson
1984,
Davies et al. 1987,
Lasenby 1988,
Readhead 1988,
Strukov et al. 1988).
 clouds
(Sargent 1988),
and high-redshift galaxies
(Koo & Kron 1987).
clouds
(Sargent 1988),
and high-redshift galaxies
(Koo & Kron 1987).
In this paper I review the current results of studies using rich clusters of galaxies to trace the large-scale structure of the Universe. I describe both general statistical analyses, such as the cluster correlation function, as well as specific studies of superclusters and their properties.
For a previous review paper on superclusters, see Oort (1983). A review paper on voids is presented in this volume by Rood (1988).
I use a Hubble constant of H0 = 100h km s-1 Mpc-1 throughout this paper.
 5. The inner contour
indicates the completeness limit of the statistical sample
(
5. The inner contour
indicates the completeness limit of the statistical sample
(