
| © CAMBRIDGE UNIVERSITY PRESS 1999
| |


2.6. Density Profile
The radial density distribution of galaxies in a rich cluster can be approximated by a bounded Emden isothermal profile (Zwicky 1957; Bahcall 1977), or by its King approximation (King 1972) in the central regions.
In the central regions, the King approximation for the galaxy distribution is

| (7) |

| (8) |
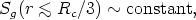
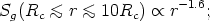
ng(r) are, respectively, the space and projected profiles (of the number density of galaxies, or brightness), n0g and S0g are the respective central densities, and Rc is the cluster core radius [where S(Rc) = S0/2]. Typical central densities and core radii of clusters are listed in the following subsection. The projected and space central densities relate as

| (9) |
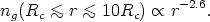
A bounded Emden isothermal profile of galaxies in clusters yields a profile slope that varies approximately as (Bahcall 1977)
| (10) |
| (11) |
therefore
| (12) |
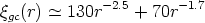
The galaxy-cluster cross-correlation function
(Peebles 1980;
Lilje and Efstathiou
1988)
also represents the average radial density distribution of galaxies
around clusters. For R
 1 clusters, and r in
h-1 Mpc, these references suggest, respectively
1 clusters, and r in
h-1 Mpc, these references suggest, respectively
| (13) |
or
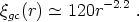
| (14) |
The average density distribution profile of galaxies in clusters thus follows, approximately,

| (15) |

| (16) |
Some substructure (subclumping) in the distribution of galaxies exists in a significant fraction of rich clusters (~ 40%) (Geller 1990).