


MEAN ZODIACAL LIGHT FLUX THROUGH HST FILTERS
The fiducial solar spectrum we have used for the purposes of creating
a low-resolution spectrum of the zodiacal light from
2500Å-1 µm is a composite of the UV solar spectrum of
Woods et al. (1997),
the optical spectrum from NL84, and the infrared
spectrum produced by
Arvesen et al. (1969),
as recommended by
Colina, Bohlin & Castelli
(1996).
The accuracy of the absolute flux of this
solar spectrum is irrelevant to the accuracy of the zodiacal light
spectrum,
IZL( );
the absolute flux of
IZL()
is defined by the measured flux of the ZL in our own
LCO spectra at 4650Å, and by a combination of that measurement plus
the color term,
C(,
4650Å), at all other wavelengths. The
color term itself is simply an empirical description of color of
whatever fiducial solar spectrum we adopted relative to the observed
color of the zodiacal light as measured in our FOS data. Thus, the
absolute flux of
IZL()
is defined by the accuracy of
the broad-band flux calibration of the FOS and LCO spectra, and the
accuracy of the ZL measurement in the LCO spectra, as described in
Paper II. The accuracy of the ZL measurement is, or course, dependent
on the Solar Flux Atlas as discussed in Paper II.
);
the absolute flux of
IZL()
is defined by the measured flux of the ZL in our own
LCO spectra at 4650Å, and by a combination of that measurement plus
the color term,
C(,
4650Å), at all other wavelengths. The
color term itself is simply an empirical description of color of
whatever fiducial solar spectrum we adopted relative to the observed
color of the zodiacal light as measured in our FOS data. Thus, the
absolute flux of
IZL()
is defined by the accuracy of
the broad-band flux calibration of the FOS and LCO spectra, and the
accuracy of the ZL measurement in the LCO spectra, as described in
Paper II. The accuracy of the ZL measurement is, or course, dependent
on the Solar Flux Atlas as discussed in Paper II.
The spectrum
IZL()
as expressed in equation 6 is then an absolute flux-calibrated spectrum
of the ZL, which we can convolve with the SYNPHOT throughput tables (using
the version released in May 1997) in the usual way to obtain the
absolute flux of the ZL through each of the filters. The flux through
the WFPC2 band is given by
| (A1) |
in which
T() is the
effective throughput of a WFPC2 filter
(including telescope and detector efficiencies),
I()
is the spectrum of the zodiacal light, and all
spectra are in units of ergs s-1 cm-2
sr-1 Å-1. No additional error results
from convolving the flux calibrated ZL with the bandpasses that
define the WFPC2 system, as any error in the SYNPHOT synthetic
photometry is incorporated in our estimate of the WFPC2 systematic
uncertainty. See Paper II for a discussion of the LCO measurement of
IZL(4650Å).
In order to estimate the contribution from the wings of detected galaxies to the mean sky flux beyond 4riso in a particular image, we have constructed a Monte Carlo simulation. In this simulation, we sum the cumulative flux contributed by randomly placed, detectable galaxies to a given point on the sky, such that the total galaxy population simulated reproduces the appropriate surface number density as a function of magnitude. If a randomly placed galaxy is close enough to the "sky pixel" that the pixel would fall within the detection aperture of the galaxy, then the trial is rejected and another begins. The extent of the galaxy apertures (how close galaxies can be to the sky pixel in question before that pixel falls within the galaxy's detection aperture) are determined based on the mean "foreground" sky level and noise characteristics assumed for the image being simulated. The simulation continues until we obtain 10,000 "sky pixels."
As faint galaxies are weakly clustered on small projected scales (Colley et al. 1996, 1997; Roche et al. 1993), we have simply placed galaxies randomly in this simulation. For the surface density of galaxies as a function of apparent magnitude, we have adopted the HDF galaxy counts at V > 23AB mag, which go 1.5 mag fainter than our own data (see Figure 8). We have assumed that the observed light profiles of faint galaxies are adequately described by an exponential profile, µr = µ0 exp(-r/h), where µ0 is the central surface brightness and h is the scale length. Using the measured values of the core surface brightness in the central 4 (undrizzled) pixels, µcore, the isophotal surface brightness, µiso, and the isophotal radius, riso for the HDF galaxies, we can determine µ0 and h (see Figures 19 and 20). As can be seen in Figures B1 and B3, h and µ0 as a function of magnitude are consistent for our data and the HDF images, given the relative surface brightness limits of each.
|
Figure B1. Fitted values of scale length,
h, and central surface
brightness, µ0 , for galaxies from the
Figures 19 (EBL data, open circles) and
20 (HDF data, points) assuming
exponential
light profiles. The HDF galaxies are plotted relative to the X-axis
at the top of the plot; EBL galaxies are relative to the lower X-axis
for clarity. The feature in both data sets which trails off to high
h at constant µ0 corresponds to galaxies
at the detection limit for which
µiso - µ0
|
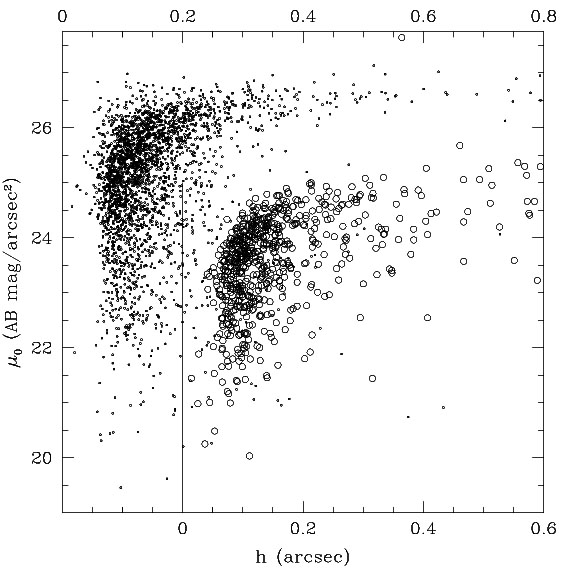
EBL images
In Figure B2, we plot histograms of the absolute
flux contributed to 10,000 sky pixels at
 5500Å in two
simulations corresponding to the surface brightness limits of our
F555W EBL images, µiso =
1
5500Å in two
simulations corresponding to the surface brightness limits of our
F555W EBL images, µiso =
1 sky =
25.6V555 AB
mag arcsec-2. In the first simulation, we define the regions
associated with galaxies by the standard aperture size used for
"total" magnitudes,
sky =
25.6V555 AB
mag arcsec-2. In the first simulation, we define the regions
associated with galaxies by the standard aperture size used for
"total" magnitudes,  2
riso. In the second simulation,
we extend the galaxy apertures to 4riso. In the first
simulation, we find that the flux from wings of galaxies contributes
2.3 × 10⁻¹⁰ergs s-1 cm-2
sr-1 Å-1 to the mean "sky" flux. As more
galaxy light is excluded from the sky mean in the second simulation, the
mean level of simulated "sky" pixels drops by just over 50% to
1.1 × 10⁻¹⁰ergs s-1 cm-2
sr-1 Å-1. The difference in flux in the
"sky" pixels is within 10% of the flux we measured in the region
1.4 - 4riso by ensemble aperture photometry, giving us
confidence in our estimate of the flux coming from beyond
4riso. Note that the
total flux from beyond the standard galaxy photometry apertures,
2.3 × 10⁻¹⁰ ergs s-1 cm-2
sr-1 Å-1, is roughly < 0.5% of the mean
sky level from diffuse zodiacal and galactic foregrounds, as indicated
on the top
x-axis of Figure B2. Note further that while the
extragalactic pedestal from galaxies outside of the 4riso
detection apertures is only 0.1% of the ZL plus DGL foreground flux
and 5% of the detected EBL in Section 11, it is
20% of the recovered flux from galaxies with V > 23 A B
mag by standard methods of galaxy photometry.
2
riso. In the second simulation,
we extend the galaxy apertures to 4riso. In the first
simulation, we find that the flux from wings of galaxies contributes
2.3 × 10⁻¹⁰ergs s-1 cm-2
sr-1 Å-1 to the mean "sky" flux. As more
galaxy light is excluded from the sky mean in the second simulation, the
mean level of simulated "sky" pixels drops by just over 50% to
1.1 × 10⁻¹⁰ergs s-1 cm-2
sr-1 Å-1. The difference in flux in the
"sky" pixels is within 10% of the flux we measured in the region
1.4 - 4riso by ensemble aperture photometry, giving us
confidence in our estimate of the flux coming from beyond
4riso. Note that the
total flux from beyond the standard galaxy photometry apertures,
2.3 × 10⁻¹⁰ ergs s-1 cm-2
sr-1 Å-1, is roughly < 0.5% of the mean
sky level from diffuse zodiacal and galactic foregrounds, as indicated
on the top
x-axis of Figure B2. Note further that while the
extragalactic pedestal from galaxies outside of the 4riso
detection apertures is only 0.1% of the ZL plus DGL foreground flux
and 5% of the detected EBL in Section 11, it is
20% of the recovered flux from galaxies with V > 23 A B
mag by standard methods of galaxy photometry.
|
Figure B2. Histogram of flux per "sky pixel" found in two Monte Carlo simulations described in Section 10. Each trial models the flux contributed to a random point on the sky by nearby galaxies. The lower X-axis shows flux in cgs units, while the top X-axis shows the flux as a fraction of the the mean foreground sky flux (dominated by ZL) at the levels observed in the EBL WFPC2 field. Surface brightness limits and sky noise levels used in this simulation to define the detection region around the simulated sources reflect the parameters of the V555 EBL images. The thick line shows the sky pixel histogram which results from extending the "detection" aperture around simulated source to the 1.4riso. The thin line shows the histogram associated with detection apertures extending to 4riso. Vertical lines mark the mean "sky" flux identified in each simulation. |
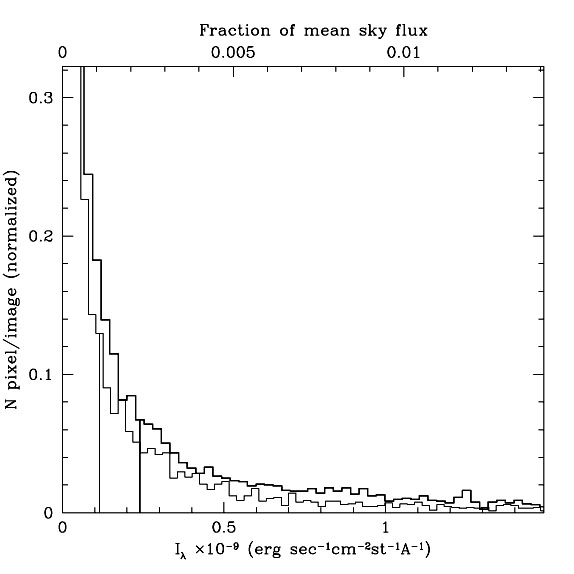
Comparison with the detection limits of the HDF
|
Figure B3. Each panel shows fitted h and µ0 for galaxies in the HDF and EBL fields in unit magnitude bins. Axes and symbol types are as in Figure B1. Lines show the µ0 and h limits for galaxies with m = 23, 24,...29. Galaxies in each magnitude bin can be seen to lie within the µ0 , h relation for that magnitude range with the exception of galaxies near the surface brightness limits of the data, for which profile solutions become ill-defined. |
As discussed in Section 10, the crucial
parameter for
predicting the flux which will be recovered from a detected galaxy is
the difference between the sky (limiting isophotal) surface brightness
and the galaxy's core surface brightness,
 µ =
µsky - µcore. The surface
brightness detection limits of our data and HDF data are demonstrated in
the Figures 19 and
20.
Figure 20 demonstrates that
galaxies in the HDF with V606 = 29 AB mag have
µ
µ =
µsky - µcore. The surface
brightness detection limits of our data and HDF data are demonstrated in
the Figures 19 and
20.
Figure 20 demonstrates that
galaxies in the HDF with V606 = 29 AB mag have
µ
 1.0 mag
arcsec-2 on average, with some galaxies in that bin nearly
reaching the limit µsky
µcore. If these
galaxies have exponential profiles, then only ~ 20% of their
total flux can be recovered by standard photometry methods. By
analogy with our data, galaxy apertures which extend to
2 riso
in the HDF will miss at least 20% of the flux
from galaxies in the range
25 < V606 < 29.5 AB mag. This light will
be included in the estimate of the local sky and thus subtracted from
the flux within the galaxy aperture, doubling the total error.
1.0 mag
arcsec-2 on average, with some galaxies in that bin nearly
reaching the limit µsky
µcore. If these
galaxies have exponential profiles, then only ~ 20% of their
total flux can be recovered by standard photometry methods. By
analogy with our data, galaxy apertures which extend to
2 riso
in the HDF will miss at least 20% of the flux
from galaxies in the range
25 < V606 < 29.5 AB mag. This light will
be included in the estimate of the local sky and thus subtracted from
the flux within the galaxy aperture, doubling the total error.
We have run the same Monte Carlo simulations described in Section B1 using
parameters that describe the noise and sky statistics of the
HDF. Using µiso =
1sky =
27.1V606 AB mag
arcsec-2, we find an extragalactic contribution to the mean sky
flux of 1.6 × 10⁻¹⁰ and 0.8 × 10⁻¹⁰ergs
s-1 cm-2 sr-1 Å-1 for
galaxy apertures extending to 1.4riso and
4riso, respectively, as
shown by the histograms in Figure B4. As for our
EBL images, this is in good agreement with estimates of the fractional
flux that should be recovered from galaxies as a function of magnitude
for the corresponding values of
µ. In
order to calculate the total flux from galaxies detected in the HDF, we
can sum the flux in the individual sources within standard,
1.4riso
apertures, and add to the resulting surface brightness twice the
flux which lies outside of those apertures as identified from the
simulated sky histogram for HDF detection parameters. Doing so, we
find that the total corrected flux from detected galaxies in the HDF
23 < V606 < 31 is 7.5 ×
10-10ergs s-1 cm-2 sr-1
Å-1 at 5850Å. Converting to the
central wavelength of the V555 filter, this is roughly
9.1 × 10⁻¹⁰ergs s-1 cm-2
sr-1 Å-1 at 5250Å, in good agreement
with the total flux from sources in our EBL field, estimated in
Section 10.2.

|
Figure B4. Same as Figure B2, but for surface bright detection limits, noise characteristics, and mean sky flux of the HDF V606 images. |