


A diffuse, non-isotropic, optical background is produced in the Milky Way by scattering of the optical interstellar radiation field (ISRF) by Galactic dust. The same dust is heated by the UV ISRF, causing it to produce thermal IR emission. It is not surprising, therefore, that the thermal Galactic emission seen in the IRAS 100 µm maps correlates well with the surface brightness of the optical diffuse Galactic light (DGL), as both are proportional to the column density of the dust and the intensity of the ambient ISRF along the line of sight. In Tables 6 and 7, we give a representative summary of the observed correlations between optical and 100 µm fluxes for regions with low to moderate 100 µm intensities (N(HI)< 5 × 1020 cm-2, I100 < 5 MJy sr-1) and a range of Galactic orientations.
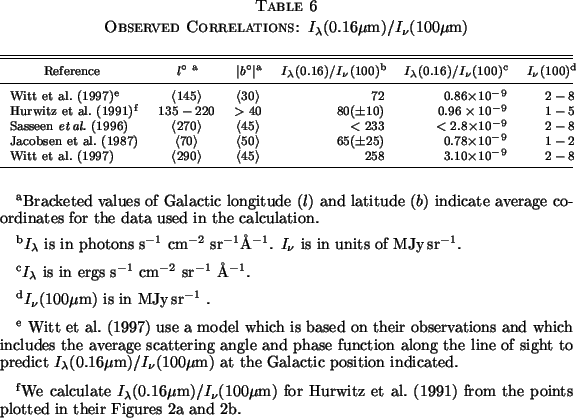
As evident from those results, there is only moderate agreement concerning the exact scaling relations between the optical DGL and thermal emission at any wavelength. Measurement errors in the IR, optical, and UV intensities are > 10% in most cases and are one cause for variations between results. However, asymmetry in the scattering phase function of Galactic dust also contributes to the variable scaling relations seen between different lines of sight. Strong forward scattering causes lower optical surface brightnesses at both high latitudes (|b| > 50°) and at longitudes away from the Galactic Center (130° < l < 230°) (see Draine & Lee 1984, and references therein; Onaka & Kodaira 1991; Witt, Friedmann, & Sasseen 1997). Both trends are evident from the data shown in Tables 6 and 7.
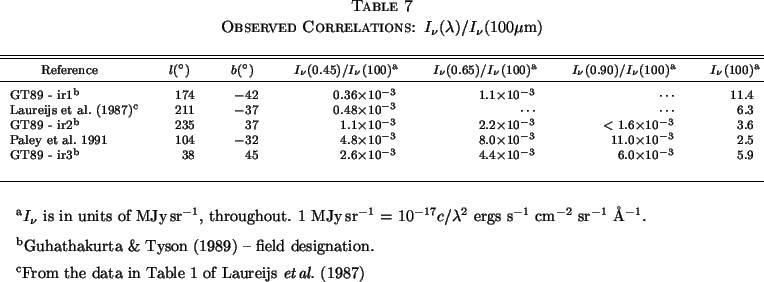
While these results suggest a range of appropriate correlation factors, they do not identify a single appropriate scaling law for our purposes for two reasons. First, variability in the measured IR-optical and UV-optical correlations is evident within a single cloud, as well as between clouds (see, for example, Figures 5 & 6 in GT89 and Table 1 in Laureijs, Mattila, & Schnur 1987). This suggests that the observed systems may be dense enough that self-shielding and further complications come into play. These clouds have been selected precisely because the optical and IR emission is bright enough to be readily observed: while the IR flux levels and N(HI) column densities of the clouds listed in Tables 6 and 7 are low enough that the molecular gas fraction does not affect the correlation between dust column density (or extinction) and N(HI), they are still roughly a factor of 10 higher than the values for our observed field, for which I100 ~ 0.4 MJy sr-1(N(HI) ~ 0.47 × 1020 cm-2, or E(B - V) ~ 0.009 mag). Second, while empirical relations between the scattered and thermal DGL have have been published in the far-UV and at optical B- and R-bands, the expected surface brightness from scattering at 3000Å is not clear from these results. Neither the optical depth of interstellar dust nor the ISRF is a monotonic function of wavelength between 1600Å and 4500Å (see Savage & Mathis 1979 and Mathis, Mezger, & Panagia 1983).
To better understand the contribution of non-isotropic DGL over the full range of our observations, we have used a basic scattering model to predict the scattered light from dust. We then compare the results of this model to the observed DGL at UV and optical wavelengths.
Assuming the Galactic cirrus along the line of sight in question is
optically thin (extinction,
A < 1.08 mag), the surface
brightness of scattered light off of interstellar dust can be expressed as
< 1.08 mag), the surface
brightness of scattered light off of interstellar dust can be expressed as
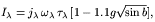
| (4) |
in which
j
is the flux of the radiation field in ergs s-1
cm-2 sr-1 Å-1;
 is the effective
albedo of the dust;
is the effective
albedo of the dust;
 is the optical depth; and the term in brackets is the back-scattered
intensity in terms of Galactic latitude, b, and the average phase
function of the dust, g
(Jura 1979).
For strong forward scattering,
g ~ 1; for isotropic scattering, g ~ 0. We take the ISRF flux,
j,
from the
Mathis et al. (1983)
estimate for the Solar Neighborhood (10 kpc from the Galactic
center). As our observations are b = 60° from the Galactic
plane and l = 206.°6 from the
Galactic center, this estimate is probably slightly high. We take the
dust albedo from the results of
Draine & Lee (1984),
which are based
on an exponential distribution in grain sizes suggested by
Mathis, Rumpl & Nordsieck
(1977).
is the optical depth; and the term in brackets is the back-scattered
intensity in terms of Galactic latitude, b, and the average phase
function of the dust, g
(Jura 1979).
For strong forward scattering,
g ~ 1; for isotropic scattering, g ~ 0. We take the ISRF flux,
j,
from the
Mathis et al. (1983)
estimate for the Solar Neighborhood (10 kpc from the Galactic
center). As our observations are b = 60° from the Galactic
plane and l = 206.°6 from the
Galactic center, this estimate is probably slightly high. We take the
dust albedo from the results of
Draine & Lee (1984),
which are based
on an exponential distribution in grain sizes suggested by
Mathis, Rumpl & Nordsieck
(1977).
The optical depth of Galactic dust,
, is well known to correlate
strongly with hydrogen column density (see
Savage & Mathis 1979,
Boulanger & Pérault
1988,
and references therein). It is not
surprising, then, that the thermal emission, I100, also
correlates well with hydrogen column density. While optical depth is
a physical manifestation only of the column density of dust,
I100
is also affected by the strength of the ISRF. We therefore use the
observed I100 and
I100/N(HI) as calibrated by
Boulanger & Pérault
(1988)
from the IRAS 100 µm maps to
obtain an effective optical depth for our observations as follows.
Optical depth can be written as a function of optical extinction and
dust column density as
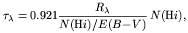
| (5) |
in which
R
= A
/ E(B - V) is the usual expression for
the normalized extinction. Several groups find N(HI) /
E(B - V) between 48 × 1020 and 50 ×
1020 cm-2mag-1 from
measurements of the HIdensities from 21cm line emission
strength and the reddening to globular clusters and star counts
(Bohlin, Savage & Drake
1978,
Burstein & Heiles 1982,
Knapp & Kerr 1974).
To get an effective optical depth (weighted by the ISRF field
strength which is at issue for scattering), we use the relation found by
Boulanger et al.
(1996)
for the low-column density regime
(N(HI) < 5 × 1020 cm-2):
I100 / N(HI)
 0.85 MJy
sr-1/(1020cm-2).
(3) The fluxes in our field are
roughly 0.4 MJy sr-1, or 0.47 ×
1020cm-2. The predicted
scattered fluxes from this model are shown in
Table 8. Scattering angle is not considered in this
model. Consequently, this estimate is conservative in the sense that it
should over-predict the DGL for our observations, as the line of sight
to our field is away from the Galactic center and the dust is forward
scattering.
0.85 MJy
sr-1/(1020cm-2).
(3) The fluxes in our field are
roughly 0.4 MJy sr-1, or 0.47 ×
1020cm-2. The predicted
scattered fluxes from this model are shown in
Table 8. Scattering angle is not considered in this
model. Consequently, this estimate is conservative in the sense that it
should over-predict the DGL for our observations, as the line of sight
to our field is away from the Galactic center and the dust is forward
scattering.
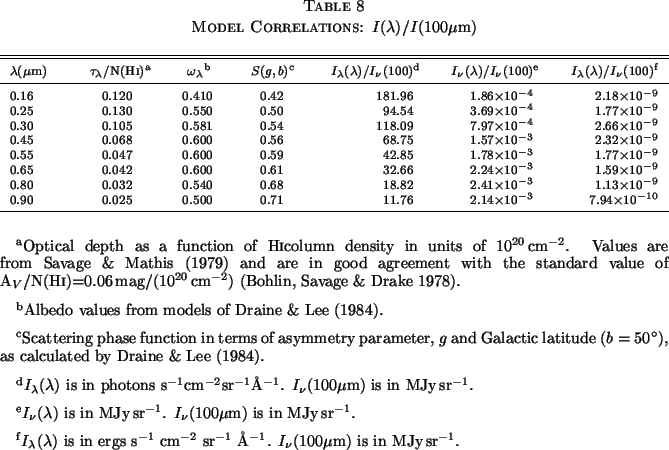
This scattering model reproduces the observed flux ratios with
reasonable accuracy in the range 1600-4500Å (see
Tables 7 and
6 at b > 45). The phase
function changes by less than 10% at latitudes |b| > 50°,
so the values shown in Table 8, for which
|b| = 50°
was used, are generally representative for high latitude fields.
However, as noted by GT89, optical colors (B - R) and
(R - I) are redder
than a basic scattering model predicts. GT89 find values of
I (R)
/ I(B)
= 3.2, 2, and 1.7 and
I(I)
/ I(R)
= 2.3,
2.1, and < 1.5 in three different fields. By comparison, the ratios
we predicted are
I(R)
/ I(B)
= 1.4 and
I(I)
/ I(R) =
0.95. A significant
H
(R)
/ I(B)
= 3.2, 2, and 1.7 and
I(I)
/ I(R)
= 2.3,
2.1, and < 1.5 in three different fields. By comparison, the ratios
we predicted are
I(R)
/ I(B)
= 1.4 and
I(I)
/ I(R) =
0.95. A significant
H contribution as the
explanation for the
red colors is ruled out by GT89. Variable scattering asymmetry with
wavelength is another possible explanation, but strong wavelength
dependence in the range 4500-9000Å has never been observed in the
lab or in space
(Witt et al. 1997,
Onaka & Kodaira 1991,
Laureijs et al. 1987).
The most plausible explanation is suggested by
observations of reflection nebulae, which have high N(HI) and
show red fluorescence from molecular hydrogen, hydrogenated amorphous
hydrocarbons, and polycyclic aromatic hydrocarbons. The relevance of
such contributions to fields with 10 times lower N(HI) and
I100, as is the case for our data, is not clear, as
the density of molecular gas correlates only with high column densities,
N(HI) > 5 × 1020cm-2. The
results of GT89, in fact,
do show that the degree of reddening is well correlated to the average
I100 emission but not structure within the cloud.
Self-shielding, local optical depth and local ISRF may be responsible
for strong variations in the correlation between color and molecular
gas density both in and between fields
(Stark 1992,
1995). It seems
conservative, therefore, to adopt optical colors found for the fields
with the lowest IR flux in the GT89 sample, listed in
Table 7. Note that the IR flux in the 2 lower
flux fields (denoted "ir2" and "ir3") is still more than a factor of 10
higher than in our own.
contribution as the
explanation for the
red colors is ruled out by GT89. Variable scattering asymmetry with
wavelength is another possible explanation, but strong wavelength
dependence in the range 4500-9000Å has never been observed in the
lab or in space
(Witt et al. 1997,
Onaka & Kodaira 1991,
Laureijs et al. 1987).
The most plausible explanation is suggested by
observations of reflection nebulae, which have high N(HI) and
show red fluorescence from molecular hydrogen, hydrogenated amorphous
hydrocarbons, and polycyclic aromatic hydrocarbons. The relevance of
such contributions to fields with 10 times lower N(HI) and
I100, as is the case for our data, is not clear, as
the density of molecular gas correlates only with high column densities,
N(HI) > 5 × 1020cm-2. The
results of GT89, in fact,
do show that the degree of reddening is well correlated to the average
I100 emission but not structure within the cloud.
Self-shielding, local optical depth and local ISRF may be responsible
for strong variations in the correlation between color and molecular
gas density both in and between fields
(Stark 1992,
1995). It seems
conservative, therefore, to adopt optical colors found for the fields
with the lowest IR flux in the GT89 sample, listed in
Table 7. Note that the IR flux in the 2 lower
flux fields (denoted "ir2" and "ir3") is still more than a factor of 10
higher than in our own.
In summary, we estimate the optical flux in our field using our
scattering model for
< 4500Å, and
adjust the predicted
scattering model at redder wavelengths to match the average colors
observed by GT89:
I(R)
/ I(B)
~ 1.8 and
I(I)
/ I(R)
~ 2.0. We apply this correction in the sense of increasing the
long wavelength fluxes over that predicted by our models, so that the
DGL estimate we use is, if anything, higher than is appropriate,
although given the small total flux associated with the DGL even a
large fractional decrease in our estimate of the DGL would have a
negligible impact on our EBL results. The resulting spectrum is flat in
I,
with a value of roughly 0.9-1.0 × 10⁻⁹ ergs
s-1 cm-2 sr-1 Å-1 from
3000-9000Å. We note, also, that our scattering model was not
dependent on Galactic longitude, which, again, makes ours a
conservative overestimate of the DGL contribution to the total sky
background, and our measurement of the EBL, therefore, a conservative
underestimate in this regard.
3 A slightly
different scaling, I100/N(HI)
0.53 MJy
sr-1/(1020cm-2), is seen in from the
DIRBE results
(Boulanger et al.
1996).
The difference is attributed to a well
known calibration offset in the IRAS maps. Since we are using IRAS
fluxes, we use the IRAS correlation.
Back.