


How can we quantify the presence of some visually prominent feature in the universe? In particular how "real" are the linear or "filamentary" distributions of galaxies suggested by recent surveys? Their implications for evolution of structure in the universe remains controversial because it is extremely difficult to assess their statistical significance. Though the visual descriptions have been rich in describing form, they are subjective, leading to attributes too vague to model or compare with numerical simulations (Barrow and Bhavsar 1987).
Recently my collaborators and I pioneered the use of a pattern recognition technique - the minimal spanning tree; MST - to identify the existence of filaments (Barrow, Bhavsar and Sonoda 1985 [BBS]) and invented a statistical technique to establish their significance (Bhavsar and Ling 1988a [BL I]; 1988b [BL II]). Though apparent to the eye, this has been the first objective, statistical and quantitative demonstration of their presence (see Nature 334:647).
The famous Lick Observatory galaxy counts (Shane and Wirtanen 1967) are a good example of the problem. The wispy appearance of this sky map (Groth et al. 1977) has evoked a strong image of the universe permeated by a galactic lace-work of knots and filaments. Yet doubts about these large-scale filamentary features remain, and for good reason. The human propensity toward finding patterns in data sets at very low levels has been responsible for some embarrassing astronomical blunders: the most notable example being the saga of the Martian canals (1) (Evans and Maunder 1903; Lowell 1906; Hoyt 1976). To test the validity of controversial visual features an understanding of human visual bias and methods to overcome it are necessary.
There have been several quantitative descriptions of galaxy clustering. Most notably the correlation function approach (Peebles 1980) has been path-breaking in the early studies of structure in the universe. The practical difficulty of measuring high order correlations, however, makes this approach unable to provide information on the profusion of specific shapes of various sizes suggested by recent data. Clustering algorithms and percolation methods have not been very successful at discriminating visual features because they each use only one parameter (respectively, the density enhancement and the percolation radius). This leads to an over simplification of the problem of recognizing patterns. In particular, the difference in visual appearance between the CfA survey and earlier simulations, that were evident to the eye, were only weakly reflected in their percolation properties (Bhavsar and Barrow 1983; 1984). Two essential requirements needed to quantify any particular feature that may be noticed in the data are; first, an objective, well defined, and repeatable method to identify this feature of interest, and second, a means of evaluating the statistical significance of this candidate object.
The Minimal Spanning Tree or MST (Zahn 1971) is a remarkably successful filament tracing algorithm that identifies filaments in galaxy maps (BBS; Ung 1987; BL I). The technique, derived from graph theory, constructs N - 1 straight lines (edges) to connect the N points of a distribution so as to minimize the sum total length of the edges. This network of edges uniquely connects all (spans) N data paints, in a minimal way, without forming any closed circuits (a tree). In order to distil the dominant features of the MST from the noise, the operation of "pruning" is performed. A tree is pruned to level p when all branches with k galaxies, where k < p, have been removed. Pruning effectively removes noise and keeps prominent features. A further operation, "separating" removes edges whose length exceeds some cut-off, lc. This gets rid of the unphysical connections in the network, just as the eye distinguishes well separated features. A pruned and separated MST is called a "reduced MST". Figure 3 illustrates the construction of the MST and the processes of pruning and separating on a simple paint set. The reader should refer to BBS for more details.

|
| Figure 3. |
The reduced MST identifies basic linear patterns in galaxy surveys and can measure them in a quantitative fashion. It is quite a good representation of how the eye-brain forms a global impression of most data sets of random or clustered point distributions. For example the MST does a fairly good job of picking out the constellations from a catalog of bright stars (Hillenbrand 1989; Hillenbrand, Bhavsar and Gott 1989).
How can we determine if the filaments that are identified are statistically significant or not? Are they unique to the distribution of galaxies or does strong small-scale clumping coupled with occasional chance alignments produce the false impression of large-scale linear structure? For this we need to know what kind of filamentary structures occur just by random chance in similarly clumped distributions. One way to do this is to use bootstrap to generate pseudo-samples of data and test them for features. We shall describe the determination of the robustness of another measure, the topology of large-scale clustering, using bootstrap samples later. For the problem of filaments, a nagging doubt is that the small scale dumping is producing the strong visual impression of filamentary structure. We can test this by applying the MST to samples that have the same small scale clumping as the data, but no large scale correlations. The data permuting technique (BL I, BL II) described below achieves this.
Suppose that our eyes (and the eyes of our colleagues) detect features that are of the order of 30 Mpc across. We choose p and lc such that the reduced MST also identifies these features. If small-scale clustering merely conspires to form large-scale features like these in a statistical way, then rearranging the galaxy distribution on the larger scales (say greater than 10 Mpc for instance), but leaving it intact on the smaller scales (in this case 10 Mpc and smaller), should have no overall effect. The original 30 Mpc features may disassociate but other similar features will come into prominence, and be identified by the reduced MST using exactly the same criteria as before. On the other hand the continued absence of such features after repeated rearrangements of the data would suggest that the original 30 Mpc features were unique to the data and not due to chance illusions.
In practice, this randomizing operation is easily performed by taking a cube of data, dividing it into smaller cubes (cubettes) and randomly shuffling the cubettes within the original volume. We have written a computer program which, given an integer n, divides a data cube of side L Mpc into n3 cubettes of side L/n Mpc, randomly translates and rotates each cubette and reassembles them into a new cube of side L Mpc (analogous to manipulating a Rubik's cube, including the inside). Many different random realizations are obtained for each value of n, and n is varied from n = 2 to n = nmax, where nmax is determined by the correlation length or some analogous measure. Note that the clustering within any cubette, of length L/n, is unchanged. All the MST techniques can now be used on this "fake" data cube to identify filaments and compare them to the original. The same procedure can also be applied in 2-D to an appropriately chosen shape extracted from 2-D data. The use of the MST ensures that exactly the same criteria will be applied to identify filamentary structures every time. If filamentary features are identified at the same level in these permuted versions of the data as they were in the original data, then we conclude that the original features are spurious, the result of statistical chance. Otherwise, the expected number of spurious filaments and their variance can be obtained for these permuted versions, at different length scales, giving us the statistical significance of the original features.
One might ask at this point: What determines a filament? Does it depend arbitrarily on the choice of lc and p? Actually our procedure provides a working definition of a filament. Filaments can be identified at all levels, depending on the values of the parameters we choose to reduce the MST. If a tree is not pruned enough the small filaments persist even after the permutations. For some minimum choice of the pruning level the features are unique to the original distribution, showing the statistical presence of linear structures, and providing a measure of what to call a filament. Our experiments show that for some distributions this point is never reached because there are no filaments present. Remember, our motivation is to objectively define a visual feature, then check for its statistical significance. That a linear feature identified at a particular p and lc is unique to the data, in fact defines for us "a filament."
Samples to be analyzed have to be chosen with care. For the above
procedure to be of value it is imperative that the data cube be a
complete sample and free from obscuration. Since this is
stressed and
elaborated on in detail in BL I we shall not say any more here. We
used the CfA redshift catalog
(Huchra et al 1983),
in the region
 > 0°
and b" > 40°, with complete red-shifts down to
apparent magnitude 14.5
and corrected for Virgo in-fall. We volume-limited this truncated cone
by applying an absolute magnitude cutoff at -18.5 mag. Inside this
volume-limited truncated cone, which contains 489 galaxies, we
inscribed the largest possible cube, measuring 41.6 Mpc
(H0 = 50
km/sec/Mpc) on each side. The data in this cube is complete and
practically tree of galactic obscuration. For details of the
positioning of the cube and its dimensions the reader should refer to
BL I. Figure 4a shows the data cube described
above, its reduced MST
and the end-to-end lengths and total lengths of the identified
filaments. This cube was permuted/reassembled many times for each
value of n, from n = 2 to n = 10. We did not
find filaments at the level
of the original data in any of these realizations. In fact
they are present at a significantly lower level.
Figure 4b shows one of these
realizations for n = 5. Again, for more details and figures,
refer to BL I.
> 0°
and b" > 40°, with complete red-shifts down to
apparent magnitude 14.5
and corrected for Virgo in-fall. We volume-limited this truncated cone
by applying an absolute magnitude cutoff at -18.5 mag. Inside this
volume-limited truncated cone, which contains 489 galaxies, we
inscribed the largest possible cube, measuring 41.6 Mpc
(H0 = 50
km/sec/Mpc) on each side. The data in this cube is complete and
practically tree of galactic obscuration. For details of the
positioning of the cube and its dimensions the reader should refer to
BL I. Figure 4a shows the data cube described
above, its reduced MST
and the end-to-end lengths and total lengths of the identified
filaments. This cube was permuted/reassembled many times for each
value of n, from n = 2 to n = 10. We did not
find filaments at the level
of the original data in any of these realizations. In fact
they are present at a significantly lower level.
Figure 4b shows one of these
realizations for n = 5. Again, for more details and figures,
refer to BL I.
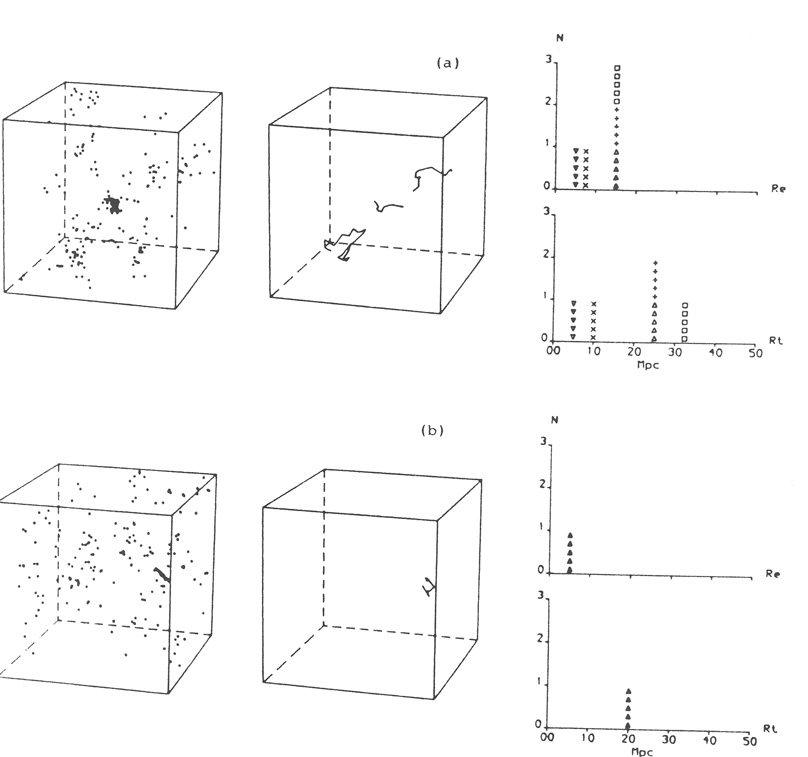
|
| Figure 4. |
We have also shown (Bhavsar and Ling 1988b, hereafter referred to as BL II) how easily our eye-brain is fooled into seeing large-scale filamentary features where none exist. The MST on the other hand identifies real filaments in toy models (see figure 1a and 1b in BL I) but is not fooled by spurious ones. This is shown using a construction now called Glass patterns (Glass 1969), produced by taking a random distribution of dots (figure 5a) which is then superimposed on itself with a slight rotation (figure 5b); figure 5c is the pruned and separated MST of the pattern in figure 5b.
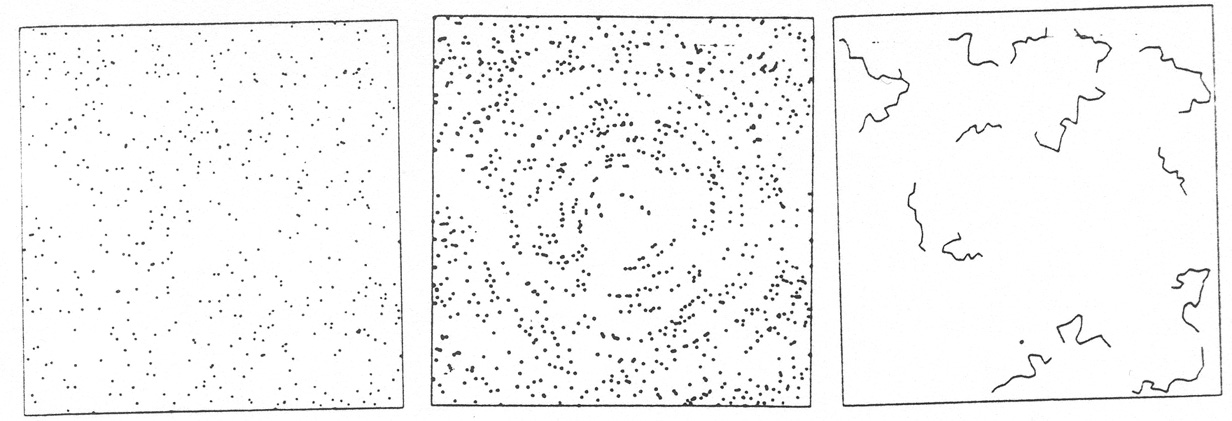
|
| Figure 5. |
The result is astonishing, the reader is urged to make transparencies of figure 5a and experiment. The visual impression is that of broken circular concentric rings of dots. Actually the dots have no auto-correlations, beyond the local pairings, but the eye-brain is fooled because it misinterprets a low level of global coherence (a result of the rotation) for large-scale linear features.
The MST is not fooled into identifying the perceived filaments. When the data permuting technique described above is used it shows that the filaments that the MST does identify are not statistically significant (see BL II for details.) Figure 6 shows the results of using the data permuting technique on figure 5b for n = 3, 5 and 10. Not only is the MST not fooled by the spurious filaments in figure 5b, but the ones it does identify are shown to be not statistically significant.
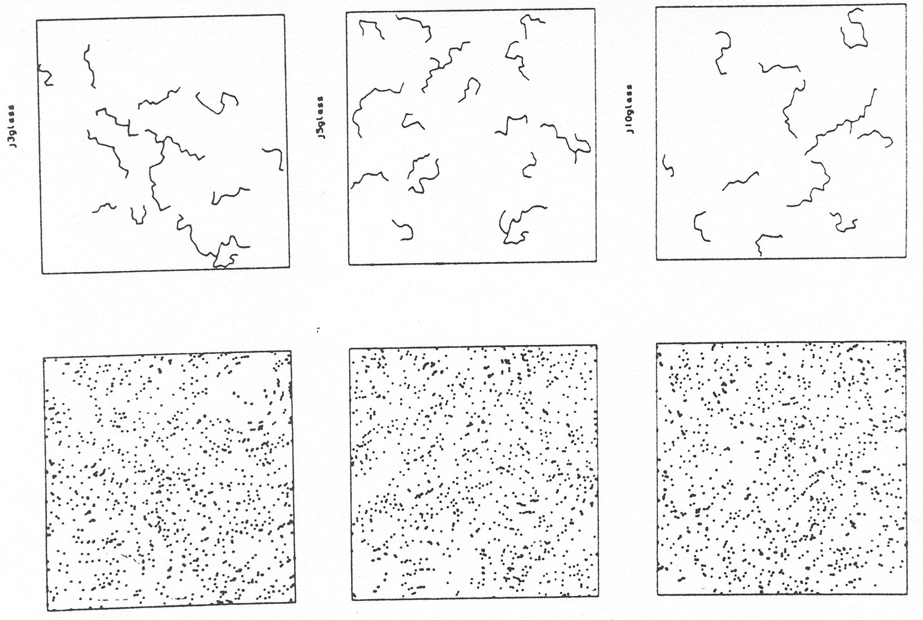
|
| Figure 6. |
Questions about the type of initial conditions and mechanisms in the early universe that make filamentary structures remain unanswered. Can they result simply from gravitational instability on initial random fluctuations in matter, or do they require specific initial conditions, or even non-gravitational mechanisms? We propose to use the demonstrated success of the MST techniques to answer this question by analyzing filamentary structure among numerical simulations and comparing them with data.
1 A more recent controversy about a visual feature on Mars, photographed in July 1976 by the Viking orbiter, is that of a mile-long rock resembling a humanoid face (Carlotto 1988)! Back.