Copyright © 1994 by Annual Reviews. All rights reserved
| Annu. Rev. Astron. Astrophys. 1994. 32:
153-90 Copyright © 1994 by Annual Reviews. All rights reserved |


....and the elements shall melt with fervent heat
II Peter 3:10
We turn finally to the p-nuclei. These are the 35 nuclei bypassed by the r- and s-processes. As we see from Figure 1, except for the light p-nuclei (92Mo, 94Mo, 96Ru, 98Ru), the abundances of p-nuclei are considerably less than those of their r- and s-nuclei counterparts. Furthermore, the p-process abundance distribution shows interesting structure with peaks at 92Mo and 144Sm. These are important clues for determining where the p-process occurs.
It is probably wrong to think that the p-process occurs in a single site. We can imagine many astrophysical settings where conditions are right to modify a pre-existing supply of r- and s-nuclei to form p-nuclei. The relevant question is really what site contributes the bulk of the p-nuclei. For more details on the p-process, the reader should consult the excellent review by Lambert (1992).
It is impossible to produce p-nuclei by neutron capture. How then can
nature make these nuclei? The first possibility that suggests itself
is proton capture. It may be that in the course of the evolution of
some system striving to reach NSE, protons are liberated which can
capture on pre-existing seed nuclei to make p-nuclei. Alternatively it
may be that in a freezeout from proton-rich NSE, free protons could
capture on seed iron-group nuclei.
 +
reactions could allow further capture of protons to higher mass.
+
reactions could allow further capture of protons to higher mass.
We can explore the conditions required for such p-processes with the
help of Figures 9 and
10. Figure 9 shows the
timescale for capture of a proton [a (p,
 ) reaction]
by the most proton-rich beta-stable
isotope of each element at the fixed temperature of T9
= 1 for different values of the proton mass density
) reaction]
by the most proton-rich beta-stable
isotope of each element at the fixed temperature of T9
= 1 for different values of the proton mass density
 Yp. The timescales for a
proton-disintegration
(,
p) reaction or for a neutron-disintegration
(,
n) reaction for these isotopes are all greater than
1010 seconds. Note that for a site with a proton mass density
Yp of 1 g cm-3, it
would take 92Mo (Z = 42) about 104 s to
capture a proton. Capture of
protons on higher-charge isotopes would take even longer. The
timescale for proton capture decreases if the setting has a higher
density of protons available. For example, for
Yp = 103 g cm-3, the
timescale for capture of protons on 92Mo would be about 10s
while for
Yp = 106 g cm-3 it would be
about 10-2 s. If an astrophysical site could
maintain a mass density in protons of 106 g cm-3
for 105 s at T9 = 1, the
proton-rich isotopes of all elements up to platinum (Z = 78) could
capture a proton. The question for finding the p-process site is
whether such conditions are possible. It is unlikely.
Yp. The timescales for a
proton-disintegration
(,
p) reaction or for a neutron-disintegration
(,
n) reaction for these isotopes are all greater than
1010 seconds. Note that for a site with a proton mass density
Yp of 1 g cm-3, it
would take 92Mo (Z = 42) about 104 s to
capture a proton. Capture of
protons on higher-charge isotopes would take even longer. The
timescale for proton capture decreases if the setting has a higher
density of protons available. For example, for
Yp = 103 g cm-3, the
timescale for capture of protons on 92Mo would be about 10s
while for
Yp = 106 g cm-3 it would be
about 10-2 s. If an astrophysical site could
maintain a mass density in protons of 106 g cm-3
for 105 s at T9 = 1, the
proton-rich isotopes of all elements up to platinum (Z = 78) could
capture a proton. The question for finding the p-process site is
whether such conditions are possible. It is unlikely.

|
Figure 9. Timescales for proton capture on
the most proton-rich isotope
of each element at the fixed temperature of T9 =
1. The curves are for mass densities in protons of
|
|
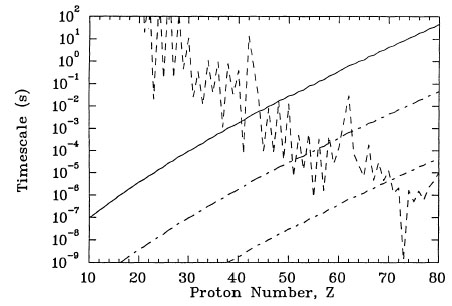
Figure 10. Same as
Figure 9 but for T9 = 3. The
short-dashed jagged curve shows the timescale for
( |
The proton-capture rates also increase with increasing temperature
because the reactants have a higher relative kinetic energy compared
to the Coulomb barrier than at lower temperature. This leads us to ask
what happens to the timescales if we increase the temperature. We see
the effect in Figure 10 for
T9 = 3. The timescale for proton capture
does indeed decrease, but so does the timescale for a
(, n)
reaction. For
Yp = 1 g cm-3, the timescale for a
(,
n) reaction is less than that for a
(p,)
reaction at
Z  40. This
means that it is
more likely under these conditions for a proton-rich nucleus to suffer a
(,
n) reaction than to capture a proton. Of course this makes
sense from our discussion in Section 2. If the
system is evolving towards
NSE, nuclei more massive than the nucleus with the highest binding
energy per nucleon will tend to disintegrate nucleons to increase the
number of macroscopic states available to the system.
40. This
means that it is
more likely under these conditions for a proton-rich nucleus to suffer a
(,
n) reaction than to capture a proton. Of course this makes
sense from our discussion in Section 2. If the
system is evolving towards
NSE, nuclei more massive than the nucleus with the highest binding
energy per nucleon will tend to disintegrate nucleons to increase the
number of macroscopic states available to the system.
For higher proton mass densities, the
(,
n) reactions do not
dominate the proton captures until higher nuclear charge:
Z 40 - 50 for
Yp = 103 g cm3 and
Z 70 for
Yp = 106 g cm-3. One might imagine
that the system could then produce p-nuclei at least up to ytterbium
(Z = 70) under such high temperature and high density
conditions. Such
conditions are extremely difficult for nature to achieve, however. The
dilemma for making p-nuclei is clear. If nature is to make these
nuclei by proton capture at low temperature where the flow will not be
impeded by disintegrations, a large supply of protons must be
available for a long time. If the proton capture process is to occur
at higher temperature where the capture timescales are shorter,
disintegration reactions will dominate the flow and prevent capture to
higher mass.
The escape from this dilemma is the realization that proton captures
need not make most of the p-nuclei. The various disintegration
reactions do the job. In particular, if pre-existing r- and s-nuclei
are exposed to high temperature, nuclear reactions will occur and tend
to drive the abundances toward NSE. The first reactions to occur are
the (,
n) reactions which produce quite proton-rich nuclei. Once the
nuclei become sufficiently proton rich, they then begin a
(,
p) and
(,
 ) cascade. In this way
the nuclei "melt"towards iron. If the
high temperature drops off quickly enough, the system does not reach
NSE and the melting will be incomplete, leaving an abundance of
proton-rich heavy nuclei - the p-nuclei. Where the disintegration flow
crosses the N = 50 and N = 82 closed neutron shells, the
disintegration timescales become large because of the particularly
strong binding energies. This is apparent in
Figure 10 as the peaks in the
(,
n) timescales at the closed shell nuclei 92Mo
(Z = 42) and 144Sm (Z = 62). Because of the
long disintegration timescales,
abundances build up at these nuclei. In this way we can explain the
peaks in the solar system's p-process abundance distribution. As a
final note, the extremely short
(,
n) timescale for 180Ta (Z = 73 in
Figure 10) explains why this fragile species is
the rarest stable isotope in nature.
) cascade. In this way
the nuclei "melt"towards iron. If the
high temperature drops off quickly enough, the system does not reach
NSE and the melting will be incomplete, leaving an abundance of
proton-rich heavy nuclei - the p-nuclei. Where the disintegration flow
crosses the N = 50 and N = 82 closed neutron shells, the
disintegration timescales become large because of the particularly
strong binding energies. This is apparent in
Figure 10 as the peaks in the
(,
n) timescales at the closed shell nuclei 92Mo
(Z = 42) and 144Sm (Z = 62). Because of the
long disintegration timescales,
abundances build up at these nuclei. In this way we can explain the
peaks in the solar system's p-process abundance distribution. As a
final note, the extremely short
(,
n) timescale for 180Ta (Z = 73 in
Figure 10) explains why this fragile species is
the rarest stable isotope in nature.