


4.4. Newer results
In the last 5 years, I have been actively working on the helium
problem, making use of the excellent spectroscopy of H II galaxies by
Terlevich & Melnick
(Campbell, Terlevich &
Melnick 1986;
Terlevich et al. 1991),
new observational data with emphasis on obtaining high
signal:noise in  6678
(which is the easiest line to interpret but
relatively weak) and what seem to be the best data in the literature,
rediscussed in a uniform manner
(Simonson 1990;
Pagel 1991).
Furthermore, we have investigated the correlation with nitrogen
as well as oxygen since the correlation with N/H seems to be somewhat
better
(Pagel, Terlevich &
Melnick 1986).
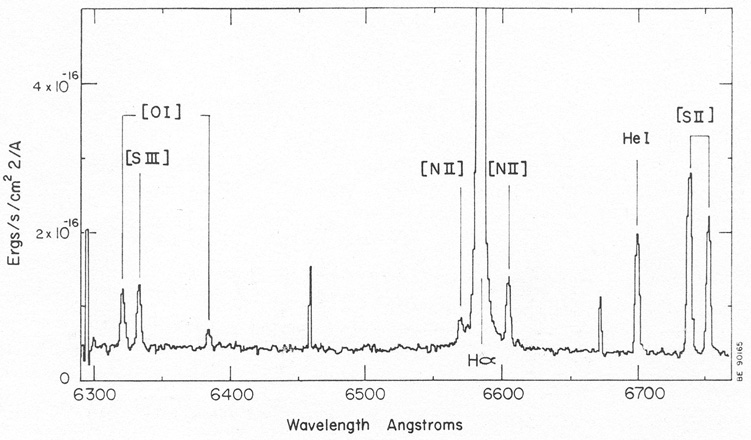
Fig. 3 shows one of our best
spectra, secured with the Anglo-Australian Telescope in 1988, which
gives accurate electron density and S+ / S++ as
well as 6678 / H
6678
(which is the easiest line to interpret but
relatively weak) and what seem to be the best data in the literature,
rediscussed in a uniform manner
(Simonson 1990;
Pagel 1991).
Furthermore, we have investigated the correlation with nitrogen
as well as oxygen since the correlation with N/H seems to be somewhat
better
(Pagel, Terlevich &
Melnick 1986).
Fig. 3 shows one of our best
spectra, secured with the Anglo-Australian Telescope in 1988, which
gives accurate electron density and S+ / S++ as
well as 6678 / H and then
in combination with blue-yellow spectrophotometry by Terlevich and his
associates gives a very secure measurement of the He/H ratio
(Pagel & Simonson
1989).
So far we have spectra of this sort for only three
objects and more are needed.
and then
in combination with blue-yellow spectrophotometry by Terlevich and his
associates gives a very secure measurement of the He/H ratio
(Pagel & Simonson
1989).
So far we have spectra of this sort for only three
objects and more are needed.
|
Figure 3. Red spectrum of the H II galaxy UM 461 (Terlevich et al. 1991) taken with the Anglo-Australian. Telescope in April 1988 by Pagel, Simonson & Terlevich, with identifications of emission lines. Narrower spikes are cosmic-ray events in the CCD detector. The spectral resolving power is about 2000. |
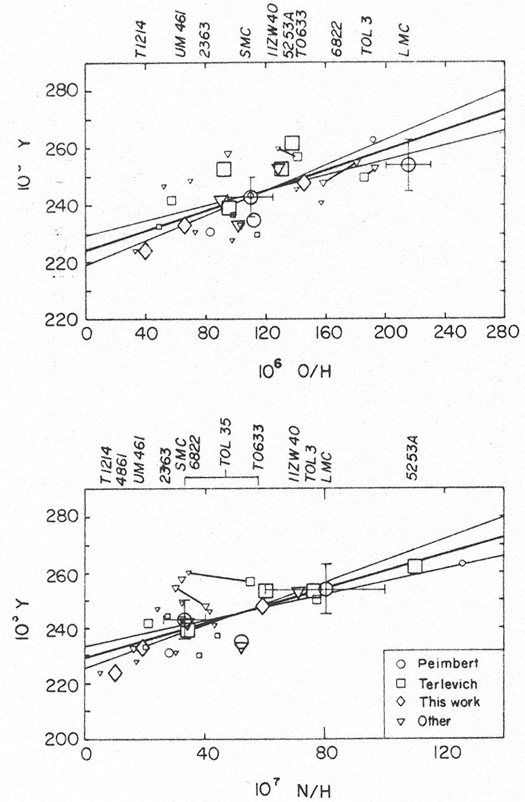
Fig. 4 shows our regression relations of helium
with oxygen and
nitrogen in low-abundance extragalactic H II regions with
maximum-likelihood linear regression lines and error limits equivalent
to ±1 . The
regressions are
. The
regressions are
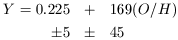
| (13) |
and
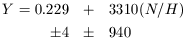
| (14) |
|
Figure 4. Regressions of helium mass
fraction against oxygen and nitrogen
abundance, respectively, in irregular and blue compact (or H II)
galaxies with oxygen up to 1/4 solar. Maximum-likelihood regression
lines are shown with alternatives equivalent to
±1 |
The regression against oxygen has a remarkably steep slope
(corresponding to
dY / dZ = 6.5±2) and suggestions of either a
flattening off towards higher abundances or significant scatter which
is absent (or at least not noticeable compared to errors) in the
regression with nitrogen (the latter, however, certainly does not
continue linearly beyond the range of the diagram; e.g. Orion has
Y  0.27,
107 N/H
700!). The reason for the
better correlation with N/H
could be local pollution by winds from Wolf-Rayet stars in the
embedded cluster which produce additional He and N overlying the basic
correlation with oxygen noted by Peimbert and his colleagues, whose
conclusions we basically confirm. The pollution hypothesis
(Pagel, Terlevich &
Melnick 1986;
Pagel 1987a,
b)
is supported by a detailed survey of NGC 5253 by
Walsh & Roy (1989),
but there are still some ambiguities
(Simonson 1990).
If the effect is not due to pollution, it
could perhaps arise from differential galactic enrichment in oxygen,
from short-lived massive stars, on the one hand, and in nitrogen and
helium, by planetary nebulae from longer-lived intermediate-mass
stars, on the other (cf.
Edmunds & Pagel 1978;
Steigman, Gallagher &
Schramm 1990).
0.27,
107 N/H
700!). The reason for the
better correlation with N/H
could be local pollution by winds from Wolf-Rayet stars in the
embedded cluster which produce additional He and N overlying the basic
correlation with oxygen noted by Peimbert and his colleagues, whose
conclusions we basically confirm. The pollution hypothesis
(Pagel, Terlevich &
Melnick 1986;
Pagel 1987a,
b)
is supported by a detailed survey of NGC 5253 by
Walsh & Roy (1989),
but there are still some ambiguities
(Simonson 1990).
If the effect is not due to pollution, it
could perhaps arise from differential galactic enrichment in oxygen,
from short-lived massive stars, on the one hand, and in nitrogen and
helium, by planetary nebulae from longer-lived intermediate-mass
stars, on the other (cf.
Edmunds & Pagel 1978;
Steigman, Gallagher &
Schramm 1990).