


5.5. Multiwavelength Continuum Variability
As noted earlier, one of the important conclusions
reached from the original AGN Watch monitoring
program was that the UV and optical continua
vary with no apparent time delay between them,
at least to the accuracy of the experiment
( 1 day in the best
cases). An important
consequence of this is that AGN continuum variability
is not due either to mechanical accretion-disk instabilities
or to variations in the accretion rate,
since such effects would be expected to propagate through
the disk (and thus across the spectrum) on
much-longer sound-crossing (Eq. (11)) or
drift time scales (Eq. (12)), respectively.
The suggestion was made
17,
15
that the UV/optical variations might in fact be
driven by X-ray variations, possibly in a manner
consistent with the X-ray reprocessing models
that were being developed to account for the
10 keV reflection hump and the equivalent width
of the 6.4 keV Fe K
1 day in the best
cases). An important
consequence of this is that AGN continuum variability
is not due either to mechanical accretion-disk instabilities
or to variations in the accretion rate,
since such effects would be expected to propagate through
the disk (and thus across the spectrum) on
much-longer sound-crossing (Eq. (11)) or
drift time scales (Eq. (12)), respectively.
The suggestion was made
17,
15
that the UV/optical variations might in fact be
driven by X-ray variations, possibly in a manner
consistent with the X-ray reprocessing models
that were being developed to account for the
10 keV reflection hump and the equivalent width
of the 6.4 keV Fe K line 32,
46,
29; both of these
features suggest that something like half of the
emitted hard X-rays in AGN interact with
"cold" (not highly ionized) matter that covers much
of the sky as seen from the source (and which might
in fact be the accretion disk itself).
If it is supposed that hard X-rays are produced
above the disk plane near the axis of the accretion
disk, then hard X-ray radiation striking the disk
should be reprocessed into lower-energy continuum photons. Moreover,
the UV/optical variations should follow those in
the X-rays, with the shortest time delays for
the higher-energy photons that are produced
predominantly in the central regions of the
accretion disk. The temperature structure of
a classical thin accretion disk is given by
line 32,
46,
29; both of these
features suggest that something like half of the
emitted hard X-rays in AGN interact with
"cold" (not highly ionized) matter that covers much
of the sky as seen from the source (and which might
in fact be the accretion disk itself).
If it is supposed that hard X-rays are produced
above the disk plane near the axis of the accretion
disk, then hard X-ray radiation striking the disk
should be reprocessed into lower-energy continuum photons. Moreover,
the UV/optical variations should follow those in
the X-rays, with the shortest time delays for
the higher-energy photons that are produced
predominantly in the central regions of the
accretion disk. The temperature structure of
a classical thin accretion disk is given by
| (41) |
and assuming that AGNs are accreting close to the Eddington rate with about 10% efficiency, the radial temperature structure becomes
| (42) |
from which we expect a peak in the spectral energy distribution in the UV/soft X-ray region, which as noted earlier might in fact be the origin of the big blue bump 81, 48.
If we suppose that a thin accretion disk is irradiated
by an X-ray source on the disk axis, we should see the
inner, hotter part of the accretion disk respond before
the outer, cooler parts. From Wien's Law, the
radiation at wavelength  arises primarily at a particular temperature corresponding to a particular
location in the disk, i.e.,
arises primarily at a particular temperature corresponding to a particular
location in the disk, i.e.,
 T-1
r3/4,
so the difference in the response times at different
wavelengths should be naively
T-1
r3/4,
so the difference in the response times at different
wavelengths should be naively

| (43) |
It is straightforward to show that this relationship holds for an irradiated disk that is heated locally by hard X-rays.
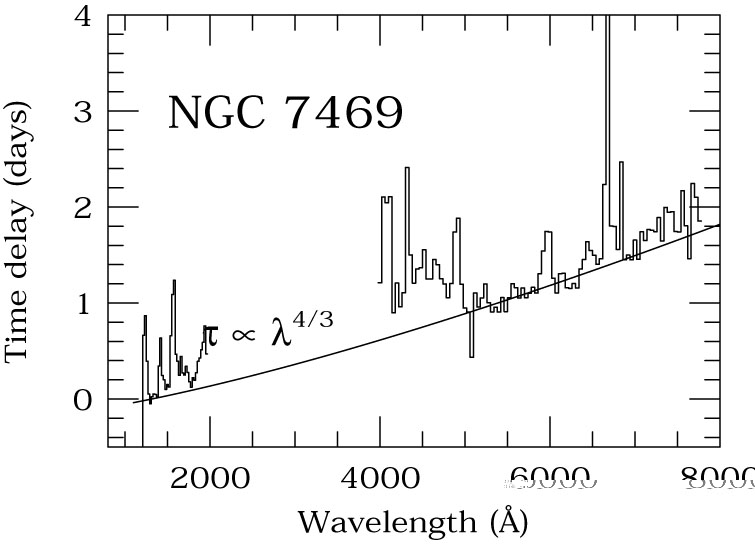
The predicted wavelength-dependent continuum time delays have been detected reliably in the case of NGC 7469, which was monitored intensively in 1996 91, 16, 42 Fig. 40 shows the result of measuring the UV and optical fluxes across the entire monitored UV and optical spectrum, and cross-correlating each of the resulting light curves with the shortest-wavelength UV continuum. Relative to the short-wavelength UV, continuum lags in other line-free continuum bands are detected at no less than 97% confidence throughout the UV/optical region.
|
Figure 40. Lag as a function of wavelength
for NGC 7469. The average flux in
each wavelength band is cross-correlated with the
shortest-wavelength UV (1315 Å)
continuum, yielding a "lag spectrum". The expected dependence
for an irradiated
thin accretion disk, |
While the evidence shows that there are in fact wavelength-dependent continuum lags in NGC 7469, this is not an unambiguous detection of a classical thin accretion-disk structure. There are several complications:
By way of contrast, a recent study of high-energy variability in NGC 5548 shows clear relationships between the hard X-rays and the lower-energy photons 12: the extreme ultraviolet (EUV) variations lead those in the soft X-ray region by about 3.5 hrs and those in the hard X-ray by about 10 hrs. The temporal order and time scales are consistent with production of both the soft and hard X-rays by Compton upscattering of lower-energy photons.
If the X-rays are indeed Comptonized lower-energy photons,
are the seed photons in the EUV ( ~ 100 Å)
or UV (~ 1000 Å)?
The only good comparison available is based on
simultaneous UV and EUV monitoring of NGC 5548 in 1993
50.
Cross-correlation of the
UV and EUV light curves shows that the UV leads, with
 cent =
0.1+0.7-0.2 days,
which is consistent with zero lag and leaves
the question unanswered.
cent =
0.1+0.7-0.2 days,
which is consistent with zero lag and leaves
the question unanswered.
A final recent observation that should be mentioned
is based on a three-year combined X-ray (RXTE) and
optical monitoring program on the narrow-line
Seyfert 1 galaxy NGC 4051
75.
During the first two years of this program, NGC 4051 behaved
in a "normal" fashion for narrow-line Seyfert 1s,
with rapid, violent X-ray variability and much lower-amplitude
optical variations. During the third year,
NGC 4051 went into a very low X-ray state.
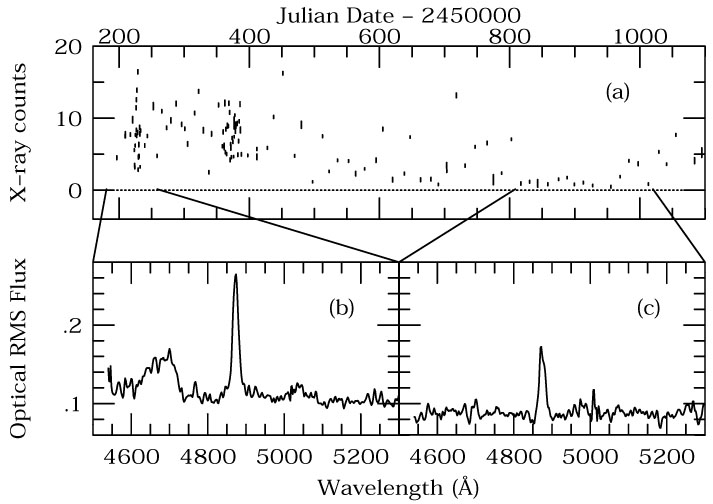
In Fig. 41, the top panel shows
the X-ray light curve. The bottom two panels show
rms optical spectra, which isolate the variable parts of the
spectrum, obtained during the two periods indicated, one
during a high X-ray state and one during the low X-ray state.
They are remarkably different. The high-state rms spectrum (lower left)
shows that the optical continuum and
the H and He II
4686 emission lines were
all varying strongly. However, the low-state rms spectrum
(lower right) shows that the optical continuum and the
H emission line are still
present and variable, but the He II line
has vanished from the rms spectrum, meaning that it is
absent or constant. Whether or not it has completely vanished
is difficult to determine on account of the blending of
He II with strong Fe II emission in the mean spectrum,
but an attempt to remove the Fe II emission by subtraction
of a template indicates that most of the He II emission
must have vanished during 1998. This indicates that
not only has the X-ray flux dramatically decreased, but
the EUV flux (which drives the He II variations) must
have also decreased by a significant amount. This
may suggest that the entire inner accretion disk has
undergone a transition to a low-radiation state, such
as an "advection-dominated accretion flow"
57.
and He II
4686 emission lines were
all varying strongly. However, the low-state rms spectrum
(lower right) shows that the optical continuum and the
H emission line are still
present and variable, but the He II line
has vanished from the rms spectrum, meaning that it is
absent or constant. Whether or not it has completely vanished
is difficult to determine on account of the blending of
He II with strong Fe II emission in the mean spectrum,
but an attempt to remove the Fe II emission by subtraction
of a template indicates that most of the He II emission
must have vanished during 1998. This indicates that
not only has the X-ray flux dramatically decreased, but
the EUV flux (which drives the He II variations) must
have also decreased by a significant amount. This
may suggest that the entire inner accretion disk has
undergone a transition to a low-radiation state, such
as an "advection-dominated accretion flow"
57.
|
Figure 41. Comparison of hard X-ray and
optical spectral variations in NGC 4051 in different X-ray states.
Panel (a) shows the 2-10 keV flux measured with
RXTE as a function time for the three-year
period 1996-1998. Panel (b) shows the
rms optical spectrum during an X-ray active period in 1996,
Panel (c) shows the rms optical spectrum during an
X-ray quiescent period in 1998. Note the absence of strong
He II |