Copyright © 1997 by Annual Reviews. All rights reserved
| Annu. Rev. Astron. Astrophys. 1997. 35:
445-502 Copyright © 1997 by Annual Reviews. All rights reserved |


5.1. Results of Variability: The Stratification of the Broad Line Region in Velocity and Degree of Ionization
OBSERVED STRATIFICATION
Among the HIL, the more highly ionized lines have shorter delays and
larger amplitudes. The He II lines at
 1640,4686 and
N V1240 vary the fastest, then C IV and
Ly
1640,4686 and
N V1240 vary the fastest, then C IV and
Ly (Figure 4).
Moreover, the wings vary faster than the core
(NGC 5548:
Krolik et al 1991,
Dietrich et al 1993,
Kollatschny &
Dietrich 1996,
Wamsteker et al
1990;
NGC 3783:
Stirpe et al 1994;
NGC 4151:
Ulrich et al 1984,
Clavel et al 1987,
Ulrich & Horne 1996;
F9:
Recondo-González
et al 1997).
(Figure 4).
Moreover, the wings vary faster than the core
(NGC 5548:
Krolik et al 1991,
Dietrich et al 1993,
Kollatschny &
Dietrich 1996,
Wamsteker et al
1990;
NGC 3783:
Stirpe et al 1994;
NGC 4151:
Ulrich et al 1984,
Clavel et al 1987,
Ulrich & Horne 1996;
F9:
Recondo-González
et al 1997).
|
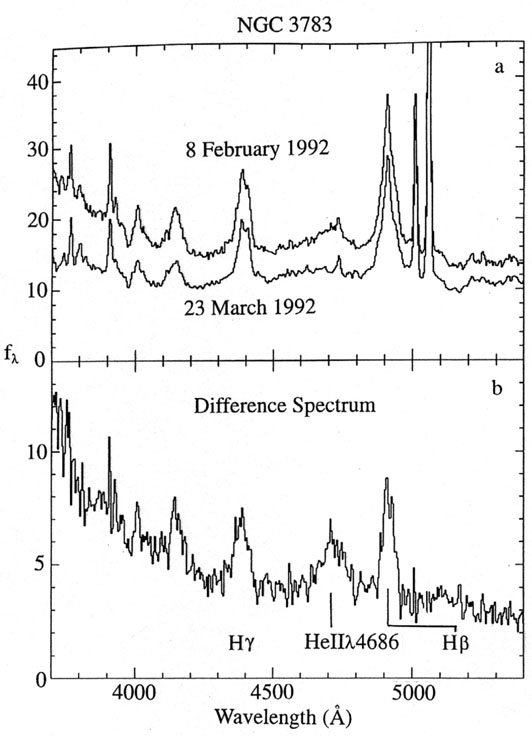
Figure 4.Top: The optical spectrum
of the nucleus of NGC 3783 on February 8 and
March 23, 1992. Bottom: The difference spectrum showing the
strong decrease and change of
spectral shape of the continuum and the varying component of the main
broad emission lines. Note the variations of the He
II |
The picture that emerges is that of a stratified highly ionized BLR with
the most highly ionized and
fastest moving gas closest to the center, and the degree of ionization
and velocity of the gas
decreasing outwards. This is a "soft" stratification with ample overlap
of the various ionization
states. The absence of extended wings in the
C III]1909
line implies an electron density
exceeding 1010 cm-3
in the innermost region of the HIL BLR.
The H ; and
H
lines have, in general, a longer time response and smaller amplitude
than the C IV line.
In NGC 5548, we see some stratification in the Balmer
line emission region as well: The wings vary
faster than the core, and the higher Balmer lines vary with larger
amplitudes and shorter time delays than the lower ones
(Dietrich et al 1993,
Wamsteker et al
1990,
Kollatschny &
Dietrich 1996,
van Groningen 1987).
Representative values of the time delay and of
rmax, the ratio of maximum to minimum emission during
a given
fluctuation are given in Table
1. The correlation coefficient is usually larger than 0.7.
; and
H
lines have, in general, a longer time response and smaller amplitude
than the C IV line.
In NGC 5548, we see some stratification in the Balmer
line emission region as well: The wings vary
faster than the core, and the higher Balmer lines vary with larger
amplitudes and shorter time delays than the lower ones
(Dietrich et al 1993,
Wamsteker et al
1990,
Kollatschny &
Dietrich 1996,
van Groningen 1987).
Representative values of the time delay and of
rmax, the ratio of maximum to minimum emission during
a given
fluctuation are given in Table
1. The correlation coefficient is usually larger than 0.7.
PHYSICAL INTERPRETATION
The variations of the HIL intensity ratios are
generally consistent with the photoionization of ionization-bounded
clouds, but there is also evidence for matter-bounded clouds:
(a) a progressively weaker response of the C IV
line to increases of the continuum flux
above a certain level and (b)
a flattening or decrease of the ratio
C IV/Ly at
high-ionizing flux levels (NGC 3516:
Ulrich & Boisson
1983;
F9:
Wamsteker & Colina
1986;
NGC 5548:
Dietrich &
Kollatschny 1995; see also
Binette et al 1989,
Sparke 1993,
Shields et al 1995).
The BLR appears to be a mix of optically thin and optically thick gas
clouds.
Some large variations of the Balmer decrement are associated with variations of the spectral shape of the optical continuum on time scales of 5-10 years and are entirely consistent with transient, strong, and variable dust extinction, possibly caused by clouds torn from the molecular torus (Goodrich 1989, 1995, Tran 1995, Villar-Martin 1996).
A CAVEAT The BLR can respond only to continuum variations that last long enough to penetrate its volume significantly, and the amplitude of the continuum variations must also be large enough to alter the gas clouds' emissivity. That is, the BLR filters out continuum variations that are too fast or too small.
For example, in NGC 4151 the continuum variations occurring in ~ 1 day (Figure 2, December 1993) did not result in any detectable variations of the C IV line intensity (Crenshaw et al 1996), although their amplitude, by a factor 1.3, was sufficient to produce line intensity variations in slower conditions.
Because the velocity and line emissivity vary with the radial distance ("stratification"), the line intensity and profile variations differ according to the duration and the amplitude of the continuum event (Netzer & Maoz 1990). Care should be exercised when comparing delays of line responses during different episodes or in different AGN. Only comparisons between events with similar continuum amplitudes are valid.
THE TREND WITH ABSOLUTE LUMINOSITY
Although the data are few, spectroscopic observations of high-luminosity
AGN show that time delays
of lines with respect to the continuum appear to increase with intrinsic
luminosity
(Zheng et al 1987,
Pérez et al
1989,
Gondhalekar 1990,
Hooimeyer et al 1992).
The recent measurement of the H;
time delay in two high-luminosity PG quasars, combined
with data for low-luminosity AGN
(Table 1), suggests the BLR radius
scales as L-0.5
(Kaspi et al 1996b).
This derived scaling is subject to the caveat above, but as the
Kaspi et al (1996b)
data have amplitudes in the range 1.4-4, it is probably valid.
3C 273 is the highest luminosity AGN
(Table 1) for which long-term
spectroscopic monitoring has
been organized (regularly observed with IUE since 1978, and every other
week since 1985).
While the continuum flux has varied several times by a factor of 2 on
time scales of ~ 2 years,
no intensity variations of Ly
+ N V above 10% have been detected
(Ulrich et al 1993
and references therein).
Therefore, only a very small fraction of the
Ly + N V
emitting gas can be within 2 light-years of the continuum source. [The
small amplitude Ly + N
V variations were judged by
Ulrich et al (1993)
not to be enough above the measurements
errors to produce a reliable value for
the time delay. With the same data set, time delays of 74 ± 33
days and 118 ± 57 days were found by
Koratkar & Gaskell
(1991),
O'Brien & Harries
(1991)).
Whatever the robustness of these values of the delay,
they apply to only a minute fraction of the
Ly + N V region.
The most important result on 3C 273 is that the variations of the
Ly + N V
line are, at most, of very small amplitude.]
This contrasts with lower luminosity AGN where a continuum flux
variation by a factor of 2 always
produces a response of the lines of comparable amplitude (e.g.
Ulrich et al 1993,
Figures 1 and
2).
This implies the quasi-absence in 3C 273 of
Ly-emitting
gas at a distance less than
c t from
the continuum source,
t being the
characteristic time scale of the
continuum variations, defined here as the time separating two maxima.
t from
the continuum source,
t being the
characteristic time scale of the
continuum variations, defined here as the time separating two maxima.