


3.4. Separations of Double Galaxies and Selection Effects
In contrast to the radial velocities, the angular separation between galaxies enters directly into the selection of pairs for the catalogue and is strongly affected by the isolation criteria. As a result, the distribution of double galaxies according to apparent linear separation shows strong selection effects.
Figure 6 presents the distribution of 585
catalogue pairs in the
projected linear separation between components, X.
The maximum in this distribution occurs at
X  12 kpc.
The majority of double galaxies occur as very tight systems, the
members of which are projected in contact with one another.
Thus, for 70% of the pairs, the separation between centers does
not exceed the sum of the diameters of the components.
There are also a few wide pairs with X > 100 kpc,
the distribution of which is shown in the inset in
figure 6.
12 kpc.
The majority of double galaxies occur as very tight systems, the
members of which are projected in contact with one another.
Thus, for 70% of the pairs, the separation between centers does
not exceed the sum of the diameters of the components.
There are also a few wide pairs with X > 100 kpc,
the distribution of which is shown in the inset in
figure 6.
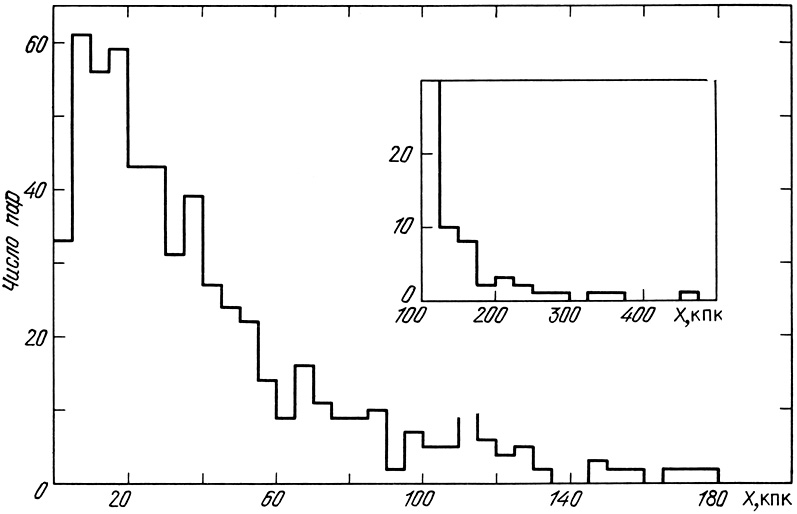 |
Figure 6. |
The distribution of the number of model pairs in projected linear separation
between components, shown in figure 7, agrees in
most regards with the catalogue distribution.
The maximum number of M-pairs takes place at the same separation,
X 12 kpc, with
a long tail extending to 400 kpc.
For the M-pairs the mean separation between galaxies (30.0 kpc)
is somewhat smaller than that for the catalogue pairs (44.2 kpc).
Physical pairs, members of systems, and optical pairs are distinguished by
various shadings in figure 7.
The mean separation between members of optical pairs (72.0 kpc)
and pseudo-pairs (39.7 kpc) is significantly larger than for the
physical double systems (16.2 kpc).
The region X > 100 kpc shows the exclusion of false M-pairs.
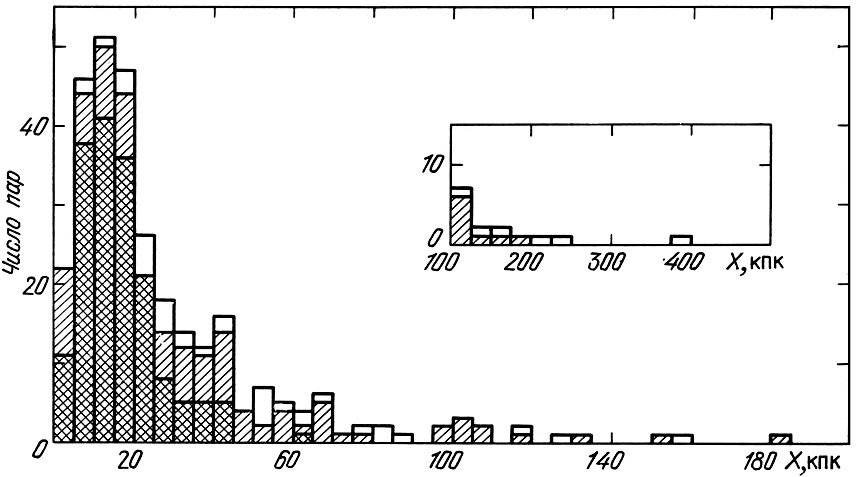 |
Figure 7. |
It is clear that the appearance of the distribution in figure 7 and the extent of its resemblance to the distribution of real (catalogue) pairs in figure 6 will depend on the choice of parameters for the modelling, given in table 3. Changes in the mean separation between modelled double galaxies and their relative numbers per unit volume may be accomplished so as to satisfy both distributions. Note that, considering the variation of these parameters, the relative number of false pairs among wide (X > 100 kpc) pairs will become dominant.
In order to quantify the effect of our selection criteria on the distribution of the component separation in pairs, we examined those physical pairs in the model which do not satisfy the isolation criteria (Karachentsev 1981c). The results of this appear in figure 8. The selectivity function Q(X) indicates the probability that a pair of galaxies with projected linear separation X will be rejected by the basic criteria (2.6) to (2.8). The curve in the figure indicates the selectivity function Q(X) approximated by
 |
(3.5) |
where k1 = 45 kpc. Just as previously expected, the isolation criteria introduce strong selection, particularly against wide pairs. For example, for X = 100 kpc, only one-tenth of the number of double galaxies satisfy this criterion.
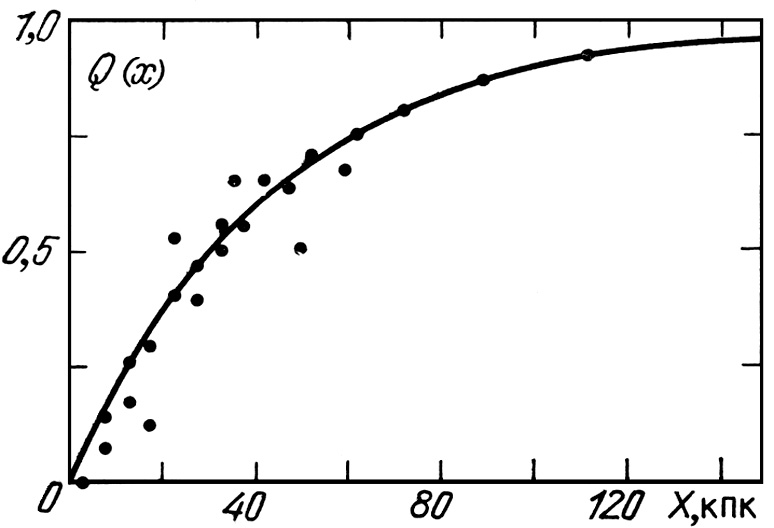 |
Figure 8. |
We might use this function (3.5) to recover the true distribution of
double galaxies by projected linear separation.
Just as in the preceding section, we will suppose that pairs with
f > 100
f are
not physical.
The distribution of the remaining 487 pairs in X is shown in
the histogram in figure 9.
This distribution shows a much less prominent tail than the distribution
for all K-pairs in figure 6.
are
not physical.
The distribution of the remaining 487 pairs in X is shown in
the histogram in figure 9.
This distribution shows a much less prominent tail than the distribution
for all K-pairs in figure 6.
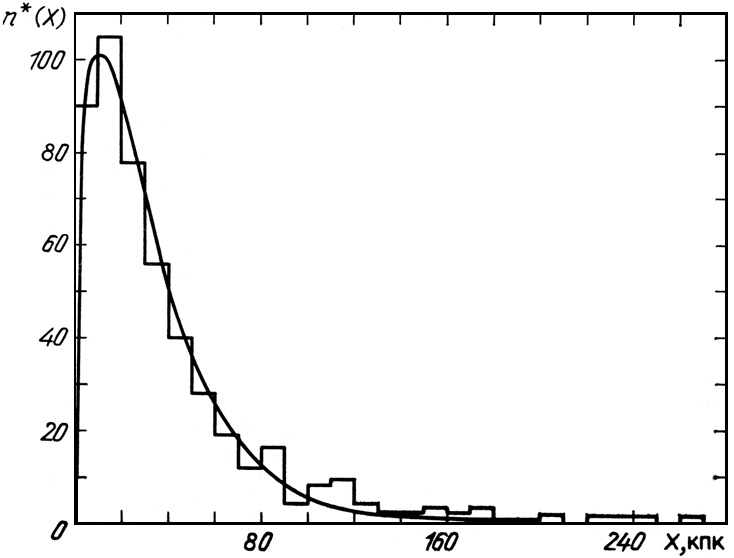 |
Figure 9. |
The mean value of the projected mutual separation for 487 double galaxies is 38.0 kpc with a standard deviation of 39.0 kpc. We will derive an analytical expression for the distribution n*(X) in figure 9. Amongst simple formulae, the gamma function satisfies the histogram in the form
 |
(3.6) |
with parameter k2 = 22.1 kpc. The expression (3.6), normalized to a sample size N* = 487, is shown as the continuous curve in figure 9. This distribution gives a mean separation between galaxies in pairs of <X> = 33.2 kpc.
Knowing the selectivity function Q(X), it is possible to derive the actual distribution of the projected separation:
 |
(3.7) |
Incorporating (3.5) and (3.6) we obtain for the undistorted distribution function the same sort of gamma function but with a different argument:
 |
(3.8) |
where k3 = k1 × k2 / (k1 - k2) = 43.4 kpc. The maximum of this distribution is located at k3 / 2 = 21.7 kpc, while the mean occurs at 3k3/2 = 65.1 kpc.
The observational data on the distribution of double galaxies according to projected separation are presented in figure 10 on a logarithmic scale. The filled points indicate the catalogue fractions from the histogram in figure 9, corrected according to (3.7) for observational selection. The vertical bars on these points indicate standard deviations. The open points indicate the same quantities for the entire sample of 585 pairs, including false, non-isolated systems. The analytical expression for these observational data, (3.8), is shown as the continuous curve.
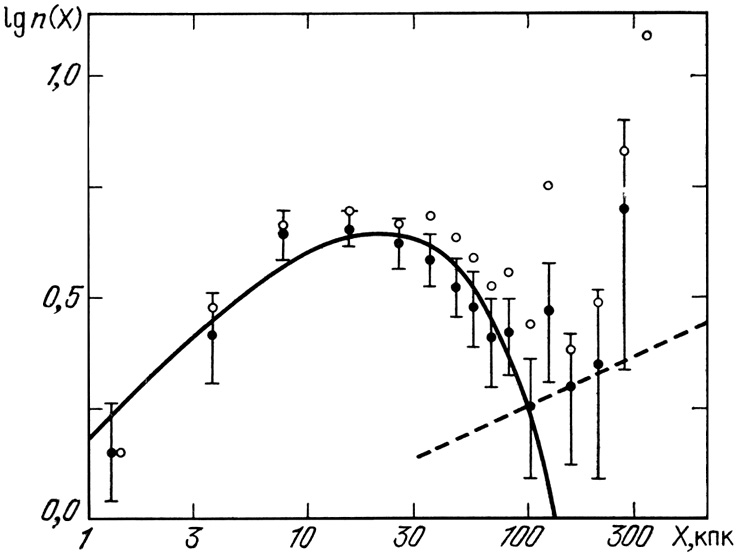 |
Figure 10. |
As we can see, the distribution of double galaxies per unit volume according to the projected separation of the components is satisfactorily described by (3.8) over the interval from 1 to 100 kpc. For X > 100 kpc the observed fraction n(X) begins to increase, but the statistical error also increases because of the small fraction of the sample in the tail of the distribution. From this it follows that, in the region X > 120 kpc, the selectivity function (see figure 8) has to be extrapolated. Calculation of the factors needed for this extrapolation, and the difficulty of removing false pairs among the wide systems, render estimates of n(X) for X > 120 kpc highly unreliable.
From the results of the modelling we showed (see
table 4) that false pairs
constitute about 43% of the sample.
Applying our criterion f > 100, the selected number of false
pairs in the catalogue is markedly small (98/585
17%).
It follows from this that our basic selection of false pairs may be
sufficiently weak that the distribution in
figure 9 begins to show the effects of members
of groups and clusters (most markedly among wide pairs).
Examining the distribution of bright galaxies to magnitude 14 with measured radial velocities, Davis and Peebles (1983) showed that the quantitative form of the two-point correlation function of galaxies is W(X) ~ X-0.77 over the interval [ 0.03 - 10] Mpc. This implies an expression n(X) ~ X0.23, which is shown as the dashed line in figure 10. The actual observations, shown as points, show a tendency in the region X > 100 kpc to lie along this predicted line. Through this, we conclude that the strange behaviour of the distribution n(X) for X > 100 kpc does not have its origin in dynamically isolated pairs but rather in the role of members of groups and clusters of galaxies. Ignoring this fact may lead to very large mistakes in estimates of the orbital masses, such as shown by Turner (1976b).
Attempts to establish the form of the distribution of double galaxies with respect to separation have been few and have yielded contradictory results. Thus, Holmberg (1954) proposed that the surface distribution of separations has the form n(R) ~ 1 - (R / Rm)3, where the maximal scale for double systems Rm is 307 kpc for H = 75 km/s/Mpc. Turner (1976b) and Peterson (1979b) for rather small samples of pairs agreed on the form of a distribution n(X) ~ X-c for the interval [20 - 200] kpc, with the parameter c = 0.5 to 0.6. White and Valdes (1980), reexamining the data of Turner and Peterson, obtained a value for the parameter c of 0.3.
As is apparent from figure 10 the data from the observations allow a description in quantitative form over the limited interval [30 - 100] kpc. The form obtained for n(X) has two special properties: it does not have a characteristic scale and it does not change its form upon transformation from projected mutual separation X to spatial separation R. However, an extrapolation of this measured distribution to R ~ 1 Mpc such as was done by Turner (1976b) does not appear to be justified, and forces characteristics onto the ensemble of double galaxies which make it difficult to satisfy the data from the very closest double systems.