Copyright © 1998 by Annual Reviews. All rights reserved
| Annu. Rev. Astron. Astrophys. 1998. 36:
189-231 Copyright © 1998 by Annual Reviews. All rights reserved |


The techniques described above have been used to measure SFRs in hundreds of nearby galaxies, and these have enabled us to delineate the main trends in SFRs and star formation histories along the Hubble sequence. Although it is customary to analyze the integrated SFRs of galaxies, taken as a whole, large-scale star formation takes place in two very distinct physical environments: one in the extended disks of spiral and irregular galaxies; the other in compact, dense gas disks in the centers of galaxies. Both regimes are significant contributors to the total star formation in the local universe, but they are traced at different wavelengths and follow completely different patterns along the Hubble sequence. Consequently, I discuss the disk and circumnuclear star formation properties of galaxies separately.
3.1. Global Star Formation Rates Along the Hubble Sequence
Comprehensive analyses of the global SFRs of galaxies have been
carried out using H surveys
(Kennicutt 1983a,
Gallagher et al 1984,
Caldwell et al 1991,
1994,
Kennicutt et al 1994,
Young et al 1996),
UV continuum surveys
(Donas et al 1987,
Deharveng et al 1994),
FIR data
(Sauvage & Thuan
1992,
Walterbos & Greenawalt
1996,
Tomita et al 1996,
Devereux & Hameed
1997), and multi-wavelength surveys
(Gavazzi & Scodeggio
1996,
Gavazzi et al 1996).
The absolute SFRs in galaxies, expressed in terms of the total mass of
stars
formed per year, show an enormous range, from virtually zero in gas-poor
elliptical, S0, and dwarf galaxies to ~ 20
M
surveys
(Kennicutt 1983a,
Gallagher et al 1984,
Caldwell et al 1991,
1994,
Kennicutt et al 1994,
Young et al 1996),
UV continuum surveys
(Donas et al 1987,
Deharveng et al 1994),
FIR data
(Sauvage & Thuan
1992,
Walterbos & Greenawalt
1996,
Tomita et al 1996,
Devereux & Hameed
1997), and multi-wavelength surveys
(Gavazzi & Scodeggio
1996,
Gavazzi et al 1996).
The absolute SFRs in galaxies, expressed in terms of the total mass of
stars
formed per year, show an enormous range, from virtually zero in gas-poor
elliptical, S0, and dwarf galaxies to ~ 20
M year-1 in gas-rich spirals. Much larger global SFRs, up to
~ 100 M
year-1, can be found in optically selected starburst
galaxies, and SFRs as high as 1000
M
year-1 may be reached in the most luminous
IR starburst galaxies (Section 4). The highest
SFRs are associated
almost uniquely with strong tidal interactions and mergers.
year-1 in gas-rich spirals. Much larger global SFRs, up to
~ 100 M
year-1, can be found in optically selected starburst
galaxies, and SFRs as high as 1000
M
year-1 may be reached in the most luminous
IR starburst galaxies (Section 4). The highest
SFRs are associated
almost uniquely with strong tidal interactions and mergers.
Part of the large dynamic range in absolute SFRs simply reflects the
enormous range in galaxy masses, so it is more illuminating to examine
the range in relative SFRs, normalized per unit mass or luminosity. This is
illustrated in Figure 3, which shows
the distribution of H +
[NII] equivalent widths (EWs) in a sample of 227 nearby bright galaxies
(BT < 13), subdivided by Hubble type.
The data were taken from the photometric surveys of
Kennicutt & Kent
(1983),
Romanishin (1990).
The measurements include the
H and
the neighboring [NII] lines; corrections for [NII] contamination
are applied when determining the SFRs. The EW is defined as the
emission-line luminosity normalized to the adjacent continuum flux, and
hence it is a measure of the SFR per unit (red) luminosity.
 |
Figure 3. Distribution of integrated
H |
Figure 3 shows a range
of more than two orders of magnitude in the
SFR per unit luminosity. The EWs show a strong
dependence on Hubble type, increasing from zero in E/S0 galaxies (within
the observational errors) to 20-150 Å in late-type spiral and
irregular galaxies. When expressed in terms of absolute SFRs, this
corresponds to a range of 0-10
M
year-1 for an L* galaxy (roughly
comparable in luminosity to the Milky Way). The SFR
measured in this way increases by approximately a factor of 20 between
types Sa and Sc
(Caldwell et al 1991,
Kennicutt et al 1994).
SFRs derived from
the UV continuum and broadband visible colors show comparable behavior
(e.g. Larson & Tinsley
1978,
Donas et al 1987,
Buat et al 1989,
Deharveng et al 1994).
High-resolution imaging of individual galaxies reveals
that the changes in the disk SFR along the Hubble
sequence are produced in roughly equal parts by an increase in the
total number of star-forming regions per unit mass or area and by an
increase in the characteristic masses of individual regions
(Kennicutt et al
1989a,
Caldwell et al 1991,
Bresolin & Kennicutt
1997).
These trends are seen both in the
H luminosities of the
HII regions as well
as in the continuum luminosity functions of the embedded OB associations
(Bresolin & Kennicutt
1997).
A typical OB star in
an Sa galaxy forms in a cluster containing only a few massive stars,
whereas an average
massive star in a large Sc or Irr galaxy forms in a giant HII/OB
association containing hundreds or thousands of OB stars. These differences
in clustering properties of the massive stars may strongly influence
the structure and dynamics of the interstellar medium (ISM) along the
Hubble sequence
(Norman & Ikeuchi
1989,
Heiles 1990).
Although there is a strong trend in the average SFRs
with Hubble type, a dispersion of a factor of 10 is present
in SFRs among galaxies of the same type. The scatter
is much larger than would be expected from observational
errors or extinction effects, so most of it must
reflect real variations in the SFR. Several factors contribute to the SFR
variations, including variations in gas content, nuclear emission,
interactions, and possibly short-term variations in the SFR within
individual objects. Although the absolute SFR varies considerably among
spirals (types Sa and later), some level of massive star formation is
always observed in deep
H images
(Caldwell et al 1991).
However, many of the earliest disk galaxies (S0-S0/a)
show no detectable star formation at all.
Caldwell et al (1994)
obtained deep Fabry-Perot
H imaging of eight
S0-S0/a galaxies, and detected
HII regions in only three objects. The total SFRs in the latter galaxies
are very low, < 0.01
M
year-1, and the upper limits on the
other four galaxies rule out HII regions fainter than those of the Orion
nebula. On the other hand,
H surveys of
HI-rich S0 galaxies by
Pogge & Eskridge
(1987,
1993)
reveal a higher
fraction of disk and/or circumnuclear star-forming regions, emphasizing
the heterogeneous star formation properties of these galaxies.
Thronson et al (1989)
reached similar conclusions
based on an analysis of IRAS observations of S0 galaxies.
The relative SFRs can also be parametrized in
terms of the mean SFR per unit disk area. This has the advantage of
avoiding any effect of bulge contamination on total luminosities
(which biases the EW distributions).
Analyses of the SFR surface density distributions have been published by
Deharveng et al (1994),
based on UV continuum observations,
and by Ryder (1993),
Ryder & Dopita
(1994),
Young et al (1996),
based on H
observations. The average SFR surface densities show
a similar increase with Hubble type, but the magnitude of the change is
noticeably weaker than is seen in SFRs per unit of luminosity (e.g.
Figure 3),
and the dispersion among galaxies of the same type is larger (see below).
The stronger type dependence in the
H
EWs (see Figure 3) is partly due to the effects
of bulge contamination, which exaggerate the change in
disk EWs by a factor of two between types Sa-Sc
(Kennicutt et al
1994),
but the change in disk EWs with type is still nearly twice as large as
the comparable trend in SFR per unit area
(Young et al 1996).
The difference reflects the tendency for the late-type spirals to have
somewhat more extended
(i.e. lower surface brightness) star-forming disks than the early-type
spirals, at least in these samples. This comparison demonstrates
the danger in applying the term SFR too loosely when characterizing
the systematic behavior of star formation across the Hubble sequence
because the quantitative trends are dependent on the manner in which the
SFR is defined. Generally speaking, a parameter that scales with the
SFR per unit mass (e.g. the
H equivalent width) is
most relevant
to interpreting the evolutionary properties of disks, whereas
the SFR per unit area is more relevant to parametrizing the dependence
of the SFR on gas density in disks.
Similar comparisons can be made for the FIR properties of disk galaxies, and these show considerably weaker trends with Hubble type (Devereux & Young 1991, Tomita et al 1996, Devereux & Hameed 1997). This is illustrated in Figure 4, which shows the distributions of LFIR / LH from a sample of nearby galaxies studied by Devereux & Hameed (1997). Since the near-IR H-band luminosity is a good indicator of the total stellar mass, the LFIR / LH ratio provides an approximate measure of the FIR emission normalized to the mass of the parent galaxy. Figure 4 shows the expected trend toward stronger FIR emission with later Hubble type, but the trend is considerably weaker, in the sense that early-type galaxies show much higher FIR luminosities than would be expected given their UV-visible spectra. Comparisons of LFIR / LB distributions show almost no dependence on Hubble type at all (Isobe & Feigelson 1992, Tomita et al 1996, Devereux & Hameed 1997), but this is misleading because the B-band luminosity itself correlates with the SFR (see Figure 2).
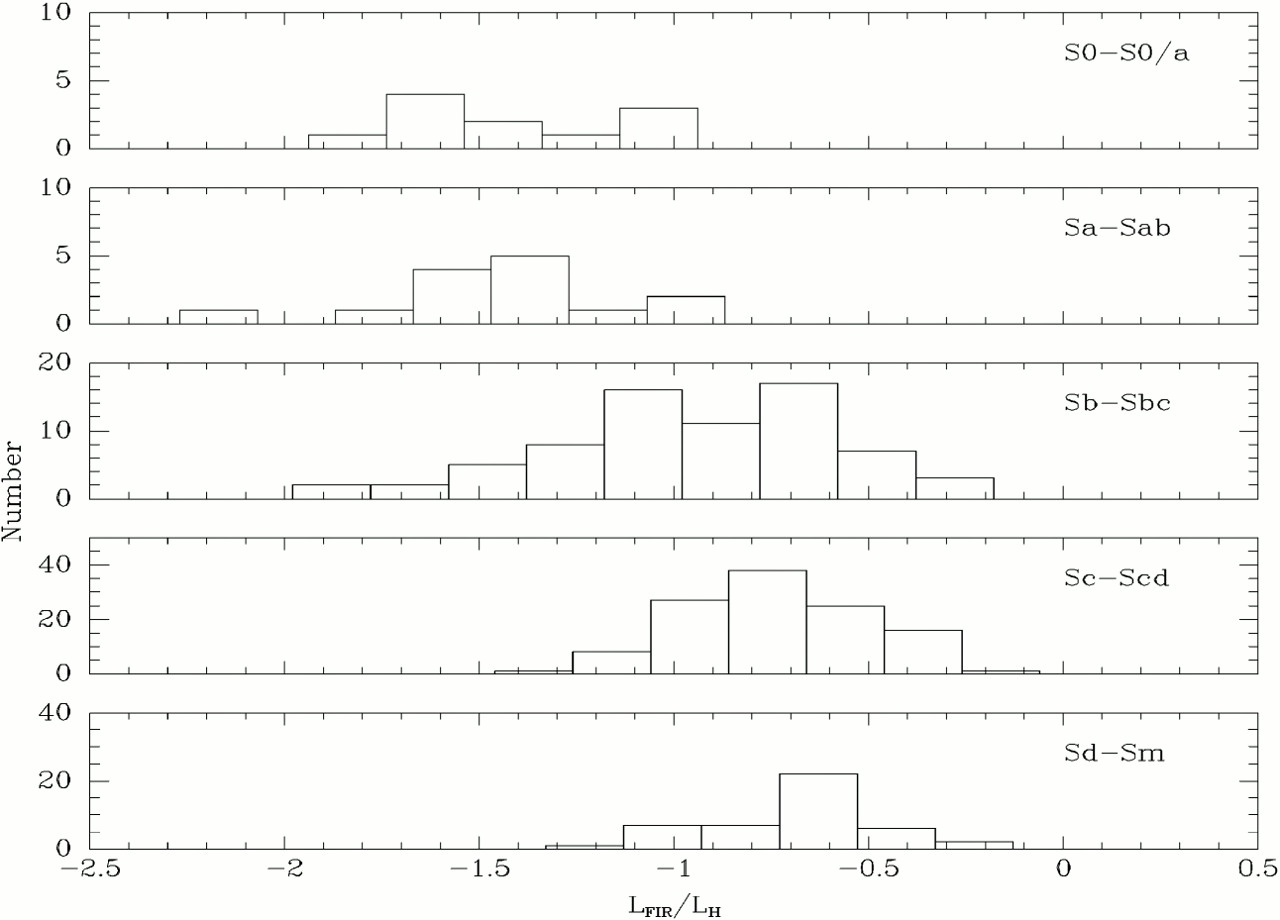 |
Figure 4. Distributions of 40- to 120-µm infrared (IR) luminosity for nearby galaxies, normalized to near-IR H-band luminosity, as a function of Hubble type. Adapted from Devereux & Hameed (1997), with elliptical and irregular galaxies excluded. |
The inconsistencies between the FIR and UV-visible properties of spiral galaxies appear to be due to a combination of effects (as mentioned in Section 2.5). In at least some early-type spirals, the strong FIR emission is produced by luminous, dusty star forming regions, usually concentrated in the central regions of barred spiral galaxies (Devereux 1987, Devereux & Hameed 1997). This exposes an important bias in the visible- and UV-based studies of SFRs in galaxies, in that they often do not take into account the substantial star formation in the dusty nuclear regions, which can dominate the global SFR in an early-type galaxy. Devereux & Hameed emphasized the importance of observing a sufficiently large and diverse sample of early-type galaxies, in order to fully characterize the range of star formation properties. However, it is also likely that much of the excess FIR emission in early-type spirals is unrelated to star formation, reflecting instead the effects of dust heating from evolved stellar populations (Section 2.5). Radiative transfer modeling by Walterbos & Greenawalt (1996) demonstrates that this effect can readily account for the trends seen in Figure 4.
The interpretation in the remainder of this review is based on the
SFR trends revealed by the
H, UV continuum,
broadband colors,
and integrated spectra, which are consistent with a common evolutionary
picture of the Hubble sequence. However, it is important to bear
in mind that this picture applies only to the extended, extranuclear
star formation in spiral and irregular disks. The circumnuclear star
formation follows quite different patterns, as discussed in
Section 4.2.