


2.2. Recent redshift surveys
Cosmology, like many other modern scientific branches, is technology driven. Nowadays, use of multi-fiber spectrographs permits to measure the redshifts of many galaxies in a single run. Numbers have changed from 5-10 redshifts of galaxies measured per night in the 70s to 2000 redshifts per night at the late 90s. The reachable magnitude limit has moved from 14 to 19.5 in the blue [4]. On the basis of this technology, new huge surveys of redshifts of galaxies are being built. The main two ongoing projects are the 2dF (2-degree Field) and the SDSS (Sloan Digital Sky Survey). More information about these surveys can be found in their Web pages: http://www.mso.anu.edu.au/2dFGRS/ for the 2dF survey and http://www.sdss.org/ for the SDSS survey.
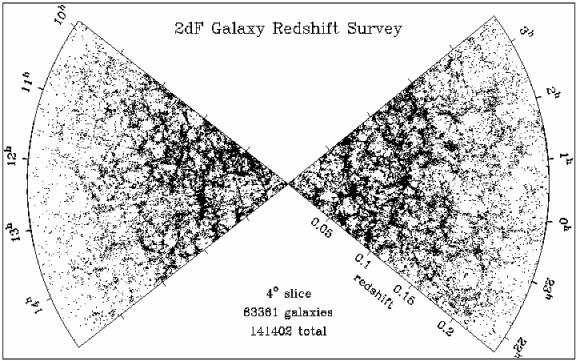
In Fig. 2 we show cone diagrams of these two samples under construction. The visual analysis of these plots reveals the characteristic patterns already noticed in the famous first slice of the universe [5] (also shown in the diagram): a bubbly structure in which filaments and walls surround empty regions nearly devoid of galaxies. The big clusters of galaxies lie typically in the intersections of this labyrinth of structures.
 |
 |
 |
Figure 2. The top panel shows two 4° slices with 63,381 galaxies from the 2dF redshift survey. The maximum depth is z = 0.25, (figure from Peacock et al. [10]). The bottom panel shows two 2.5° slices with 24,915 galaxies from the SDSS survey. The outer circle has redshift z = 0.2 (figure from Loveday [11]). As an inset, the first CfA slice from de Lapparent, Geller, and Huchra [5] is shown to scale. |
Nevertheless, the new surveys display an important difference with respect to the older shallower slices: The depth of the surveys - being now several times larger - has allowed, for the first time, to be sure that the observed structures are much smaller than the size of the survey itself. This was not the case at the end of the 80s when the first Center for Astrophysics (CfA) slice was compiled. At that time it was not clear if the observed large-scale structures were going to increase in size with the survey depth. The first serious evidence on the contrary came with the Las Campanas Redshift Survey (LCRS) [6, 7]. This survey represented the beginning of the end [8] in the sense that the characteristic structures of the galaxy distribution - voids, walls, and filaments - reached a maximum size and no structures of larger size were observed, as it should be expected if the distribution of galaxies was to be an unbounded fractal [9]. This trend has been reinforced by the 2dF and Sloan first cone diagrams (see Fig. 2).