

The infrared properties of the GPS and CSS sources can in principle shed light on the properties of the central engine and its immediate environment. Consider the expected mid-far-infrared (MFIR) properties of GPS/CSS sources compared to those of a sample of classical double radio sources with the same extended radio power and redshift. If the nucleus in GPS sources is surrounded by gas and dust with a higher covering factor than in "normal" extended radio galaxies, then we might expect a higher fraction of the optical-UV continuum light to be reprocessed and to emerge as MFIR radiation. Thus, in this scenario, we might expect the GPS sources to be brighter in the MFIR than "normal" radio sources. On the other hand, it is possible that the jets in the GPS sources convert a higher fraction of their energy into radio luminosity because of the interaction with the dense and clumpy environment (see, e.g., Eilek & Shore 1989; Gopal-Krishna & Wiita 1991; De Young 1993). This enhanced efficiency means that the GPS sources will be intrinsically weaker than a sample matched in radio power. In this case we might expect the GPS sources to be weaker in the MFIR than the comparison sample.
Heckman et al. (1994) constructed samples of GPS and CSS galaxies and quasars and matched them in radio power at 5 GHz and in redshift with comparison samples of classical double 3CR radio galaxies and quasars. They have determined the IRAS flux densities for the ensembles of objects using the SUPERSCANPI algorithm at IPAC. Note that most GPS and CSS sources are not detected by IRAS. Thus, these results only apply to the ensemble.
A summary of the
Heckman et al. (1994)
results is given in Table 6. Heckman et al. find that
the 3CR galaxy comparison sample is detected at wavelengths
 25 µm,
while the GPS galaxies are detected at only 60 µm in the
mean value, but not in the median, consistent with the mean value being
dominated by a few larger values. However, the limits on the GPS
galaxies are similar to the detections of the comparison sample, so no
strong statements can currently be made. The data are consistent with
the GPS galaxies and the comparison sample having similar MFIR infrared
properties and rest-frame 50 µm luminosities
 1012
L
 . On
the other hand, the quasars, although at higher mean redshift, are
detected at higher flux density levels and at more wavelengths than the
galaxies. The GPS/CSS quasars are detected at wavelengths
 25 µm,
while the 3CR comparison sample is detected at
 12
µm. The two samples have similar MFIR flux densities to
within a factor of about 2. The 50 µm luminosities of the
GPS/CSS quasars are roughly 3 × 10¹²
L
 . Note
that the MFIR luminosity of the GPS/CSS sources is comparable to that of
the ultraluminous IRAS galaxies (see, e.g.,
Sanders et al. 1988).
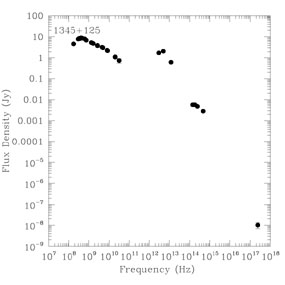
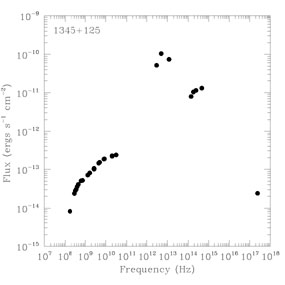
The plot of the spectral energy distribution for the GPS radio galaxy
1345+125
(Fig. 14) shows that the energy output
peaks in the mid-IR around 60 µm similar to the sources
studied by
Vader et al. (1993).
| log P5GHz | S12 µm | S25 µm | S60 µm | S100 µm | L50 µm | |||
| Sample | N | z | (W Hz-1) | (mJy) | (mJy) | (mJy) | (mJy) | (ergs s-1) |
| (1) | (2) | (3) | (4) | (5) | (6) | (7) | (8) | (9) |
| RG (z,P) | 51 | 0.753 | 27.0 | < 9 | 16±4 | 25±5 | 51±10 | 2.3×1045 |
| GPSCSSG (z,P) | 33 | 0.766 | 27.1 | < 12 | < 15 | < 27 | < 102 | 3.3×1045 |
| Q (z,P) | 28 | 0.945 | 27.3 | 18±4 | 29±4 | 51±5 | 114±29 | 2.1×1046 |
| GPSCSSQ (z) | 22 | 0.934 | 27.6 | < 12 | 21±7 | 39±8 | 92±24 | 1.0×1046 |
| GPSCSSQ (P) | 11 | 0.766 | 27.2 | < 24 | < 21 | 51±11 | 227±34 | ... |
NOTES. - Column (1) RG and Q are the 3CR
comparison sample of radio
galaxies and quasars, respectively. The letter in parenthesis
designates the criteria
for matching the sample, e.g., z means that the sample was
matched on redshift. Column (2) The number of objects in the
sample. Column (3) The mean redshift of the sample. Column (4) the mean log
Power at 5GHz. Columns (5)-(8) The median flux density
of the sample at 12, 25, 60, and 100 µ, respectively from
SUPERSCANPI. Column (9) The
characteristic luminosity
| ||||||||
 |
 |
Figure 14. (a) Broadband spectrum
F |
Hes, Barthel, & Hoekstra (1995) performed a study of the IRAS-detected 3CR quasars and radio galaxies. They also did not find strong evidence for a difference in properties of CSS sources with non-CSS sources. Thus, the similarity of the GPS/CSS samples with their comparison samples is consistent with neither the covering factor of the circumnuclear dust nor the jet efficiency being extremely different (i.e., to within a factor of a few) in the GPS/CSS sources and the classical doubles. Preliminary results from ISO are also consistent with this conclusion (Fanti et al. 1998, in preparation).