


8.3. The Alignment Effect
At high redshifts (z
 0.6) in the
large-scale radio sources there is a component of blue light that is
aligned with the radio source axis (see, e.g.,
McCarthy et al. 1987;
Chambers et al. 1987;
McCarthy 1993
and references therein). The currently most likely explanations for the
aligned component include (1) young stars from a "jet-induced starburst"
(see, e.g.,
De Young 1989;
Rees 1989;
Daly 1990;
Begelman & Cioffi
1989),
(2) scattered nuclear continuum
(Tadhunter, Fosbury,
& di Serego Alighieri 1988;
Fabian 1989), (3)
inverse Compton
scattering from the radio-emitting electrons
(Daly 1992),
and (4) nebular continuum
(Dickson et al. 1995),
or some combination of these.
0.6) in the
large-scale radio sources there is a component of blue light that is
aligned with the radio source axis (see, e.g.,
McCarthy et al. 1987;
Chambers et al. 1987;
McCarthy 1993
and references therein). The currently most likely explanations for the
aligned component include (1) young stars from a "jet-induced starburst"
(see, e.g.,
De Young 1989;
Rees 1989;
Daly 1990;
Begelman & Cioffi
1989),
(2) scattered nuclear continuum
(Tadhunter, Fosbury,
& di Serego Alighieri 1988;
Fabian 1989), (3)
inverse Compton
scattering from the radio-emitting electrons
(Daly 1992),
and (4) nebular continuum
(Dickson et al. 1995),
or some combination of these.
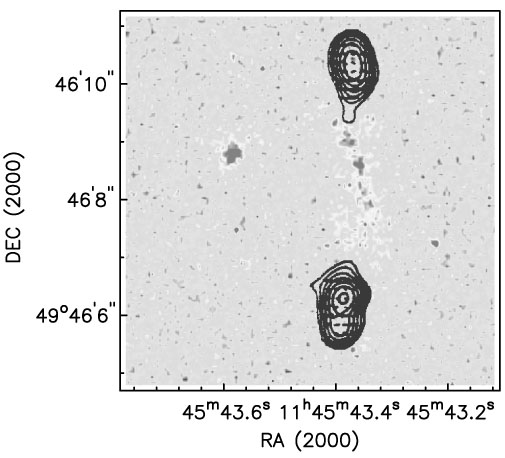
Using ground-based imaging, Gelderman (1994) found a general alignment between the optical and radio position angles in 13 CSS sources. Röttgering et al. (1996) have presented Hubble Space Telescope (HST) observations of the alignment effect in two CSS sources. de Vries et al. (1997b) using HST's second Wide Field Planetary Camera (WFPC2) images in a broad red filter also find a strong alignment effect in 12 CSS sources (see Fig. 16 for a couple of examples), one of which is in common with Röttgering et al. (1996). Lehnert (1996) has presented an independent analysis of the quasars in the de Vries et al. sample and reached the same conclusions. There is good agreement between the alignments seen by Gelderman and de Vries et al. for the few sources in common. The alignment angles (optical-radio position angle) are shown in Figure 17 for the Gelderman and de Vries et al. CSS sources and the O'Dea et al. (1996a) GPS galaxies. The GPS galaxies tend not to show the alignment effect; however, this may be due to the lack of observations with sufficient resolution. As noted by de Vries et al., the CSS sources show the alignment effect at all redshifts, in contrast to the large-scale sources, which only show it at high redshift (Fig. 17b).
 |
 |
Figure 16. adio contours overlaid on gray scale of HST WFPC2 F702W image from W. H. de Vries (1997, private communication; see also de Vries et al. 1997b). Note the strong alignment between the radio and optical. (a) 3C 266; (b) 3C 303.1. |
 |
 |
Figure 17. (a) Histogram of
alignment angle (optical-radio position angle) for CSS sources from
Gelderman (1994) and
de Vries et al. (1997b)
and GPS sources from
O'Dea et al. (1996a).
GPS sources are shaded. (b) Plot of alignment angle vs. redshift
for CSS and large-scale 3CR sources
(de Vries et al. 1997b).
Note that the CSS sources have a strong alignment at all redshifts,
while the large-scale 3CR sources are aligned at high redshift
(z
|
Analysis of HST WFPC2 linear ramp filter observations centered on
rest-frame [O II]
 3727 or
[O III]
5007 suggests that the
dominant contribution to the alignment effect seen in the R band
is emission-line gas
(de Vries et al. 1998a).
This is consistent with
Gelderman & Whittle's
(1994)
result that the CSS sources are very luminous in optical emission
lines. In addition,
Bicknell et al. (1997)
expect emission-line gas (shocked by the radio source) to be aligned
with the CSS radio sources. Thus, the emission-line nature of the
aligned component supports the hypothesis that the CSS sources interact
strongly with their gaseous environment.
3727 or
[O III]
5007 suggests that the
dominant contribution to the alignment effect seen in the R band
is emission-line gas
(de Vries et al. 1998a).
This is consistent with
Gelderman & Whittle's
(1994)
result that the CSS sources are very luminous in optical emission
lines. In addition,
Bicknell et al. (1997)
expect emission-line gas (shocked by the radio source) to be aligned
with the CSS radio sources. Thus, the emission-line nature of the
aligned component supports the hypothesis that the CSS sources interact
strongly with their gaseous environment.