


We have observed the whole sample of 114 galaxies in B, R,
and in
the light of H during a
total of 11 observing runs between
June 2001 and July 2002. Nine of the observing runs were carried out
at the Palomar Observatory 60-inch telescope using CCD Camera with the
2048 × 2048 pixel CCD#13 attached. The pixel scale was 0.378
arcsec/pixel. Two additional observing runs were carried out at the du
Pont 100-inch telescope in Las Campanas Observatory (Chile) between
February 8-9 2002 and March 5-9 2002. We used the Direct CCD with the
2048 × 2048 pixel Tek5 CCD attached, which, placed at the
Cassegrain focus of the telescope, gives a scale of 0.260
arcsec/pixel. In Table 2 we give a summary of the
observing runs and the properties of the detectors used (gain, readout
noise, etc).
during a
total of 11 observing runs between
June 2001 and July 2002. Nine of the observing runs were carried out
at the Palomar Observatory 60-inch telescope using CCD Camera with the
2048 × 2048 pixel CCD#13 attached. The pixel scale was 0.378
arcsec/pixel. Two additional observing runs were carried out at the du
Pont 100-inch telescope in Las Campanas Observatory (Chile) between
February 8-9 2002 and March 5-9 2002. We used the Direct CCD with the
2048 × 2048 pixel Tek5 CCD attached, which, placed at the
Cassegrain focus of the telescope, gives a scale of 0.260
arcsec/pixel. In Table 2 we give a summary of the
observing runs and the properties of the detectors used (gain, readout
noise, etc).
| Run | Nights | Observatory | Telescope | Detector | Scale | Gain | RN |
| ("/pix) | (e-/ADU) | (e-) | |||||
| (1) | (2) | (3) | (4) | (5) | (6) | (7) | (8) |
| Jun01 | 06-09 | Palomar | 60" | CCD#13 | 0.378 | 1.6 | 6.3 |
| Sep01 | 10-12 | Palomar | 60" | CCD#13 | 0.378 | 1.6 | 6.3 |
| Nov01 | 08-09 | Palomar | 60" | CCD#13 | 0.378 | 1.6 | 6.3 |
| Dec01 | 04-09 | Palomar | 60" | CCD#13 | 0.378 | 1.6 | 6.3 |
| Jan02 | 14-16 | Palomar | 60" | CCD#13 | 0.378 | 1.6 | 6.3 |
| Jan02B | 20-23 | Palomar | 60" | CCD#13 | 0.378 | 1.6 | 6.3 |
| Feb02 | 08-09 | Las Campanas | 100" | Tek5 | 0.260 | 2.0 | 6.6 |
| Mar02 | 05-09 | Las Campanas | 100" | Tek5 | 0.260 | 3.0 | 7.0 |
| Mar02B | 14-19 | Palomar | 60" | CCD#13 | 0.378 | 1.6 | 6.3 |
| May02 | 13-16 | Palomar | 60" | CCD#13 | 0.378 | 1.6 | 6.3 |
| Jul02 | 01-08 | Palomar | 60" | CCD#13 | 0.378 | 1.6 | 6.3 |
| Note. - Columns stand for: (1) Observing run. (2) Nights observed. (3) Observatory. (4) Telescope. (5) Detector. (6) Spatial scale at the detector in arcsec/pixel. (8) Gain of the detector in e-/ADU. (9) Readout noise of the detector in e-. Note that two different gain settings were used during the Las Campanas observing runs. |
|||||||
Typical exposure times in B, R, and
H were, respectively,
15, 45, and 90 min at Palomar Observatory and 15, 15, and 30 min at
Las Campanas. A total of 86 galaxies were observed at Palomar
Observatory and 28 at Las Campanas. The seeing (FWHM) in the images
ranged from 0.6 arcsec (Tol 002 in R) to 4.3arcsec (Haro 14
in B). The median seeing values in B, R, and
H were 1.8,
1.6, and 1.5 arcsec, with 80 per cent of the galaxies having seeing
better than 2.5, 2.0, and 1.9 arcsec, respectively. The image quality
at Las Campanas Observatory was significantly better than at Palomar
Observatory. In this sense, the median seeing of the B, R, and
H images taken at Las
Campanas were 1.1, 0.9, and 0.9 arcsec,
respectively, whereas at Palomar Observatory the median seeing values
achieved were 2.0, 1.7, and 1.6 arcsec. In Table 3
we give
a summary of the characteristics of some of the images contained in
this Atlas, including observatory, telescope, date, exposure time,
number of frames, airmass, and FWHM (the complete table is available
in the electronic version of the paper). The date of observation given
in this table corresponds to the civil date at the start of the
observing night.
| Object Name | Tel | B-band |
R-band |
H |
|||||||||||
| Date | texp | X | PSF | Date | texp | X | PSF | Date | texp | X | PSF | ||||
| (s) | (") | (s) | (") | (s) | (") | ||||||||||
| (1) | (2) | (3) | (4) | (5) | (6) | (7) | (8) | (9) | (10) | (11) | (12) | (13) | (14) | ||
| IC 10 | P60 | 01/20/02 | 1×900 | 1.24 | 2.5 | 12/06/01 | 3×900 | 1.12 | 1.8 | 12/06/01 | 3×1500 | 1.12 | 1.8 | ||
| HS 0029+1748 | P60 | 12/07/01 | 1×900 | 1.08 | 3.5 | 11/08/01 | 3×600 | 1.05 | 1.5 | 11/08/01 | 2×1800 | 1.15 | 1.5 | ||
| Haro 14 | P60 | 12/07/01 | 1×900 | 1.55 | 4.3 | 09/11/01 | 3×600 | 1.66 | 1.9 | 09/11/01 | 3×1800 | 1.53 | 1.8 | ||
| UM 285 | P60 | 07/07/02 | 1×900 | 1.70 | 2.0 | 07/05/02 | 3×600 | 1.66 | 1.7 | 07/05/02 | 3×1200 | 1.45 | 1.8 | ||
| UCM 0049-0045 | P60 | 01/21/02 | 1×900 | 1.48 | 3.2 | 01/14/02 | 1×900 | 1.40 | 3.6 | 01/14/02 | 2×1200 | 1.55 | 2.9 | ||
| UM 323 | P60 | 07/07/02 | 1×300 | 1.64 | 2.2 | 07/03/02 | 3×600 | 1.75 | 1.9 | 07/03/02 | 2×1500 | 1.60 | 2.0 | ||
| Mrk 996 | P60 | 12/04/01 | 1×900 | 1.32 | 3.3 | 09/12/01 | 3×600 | 1.57 | 1.6 | 09/12/01 | 3×1800 | 1.35 | 1.4 | ||
| UM 133 | P60 | 07/07/02 | 1×900 | 1.73 | 2.3 | 07/06/02 | 1×600 | 1.75 | 1.5 | 07/01/02 | 3×1200 | 1.85 | 2.6 | ||
| UM 382 | P60 | 12/04/01 | 1×900 | 1.24 | 2.4 | 11/09/01 | 3×600 | 1.25 | 1.1 | 11/09/01 | 2×1800 | 1.21 | 1.2 | ||
| UM 404 | P60 | 12/07/01 | 2×900 | 1.29 | 3.8 | 12/05/01 | 3×900 | 1.56 | 2.5 | 12/05/01 | 3×1800 | 1.28 | 1.7 | ||
Note. - Columns stand for: (1) Galaxy
name. (2) Observatory and
telescope (P60: Palomar Observatory 60-inch; C100: Las Campanas
observatory du Pont 100-inch). (3) Date of observation for the
B-band image. (4) Number of frames and exposure time per frame for
the B-band in seconds. (5) Mean airmass of the B-band
exposure. (6) Seeing (FWHM) of the B-band image in
arcsec. (7-10) The same as (3-6) for the R-band
exposure. (11-14) The same as (3-6) for the
H |
|||||||||||||||
In Figure 2 we give the spectral response
functions of the
filters used in this Atlas as provided by the manufacturers. Thin
continuous-lines correspond to the filters used at the Palomar
Observatory 60-inch telescope and broad-lines to those used at Las
Campanas 100-inch telescope. This figure clearly shows that the
Johnson-B and Cousins-R filters used in this Atlas are very
similar to those used by
Landolt (1992a)
to build his list of standard
stars (dotted-line) and also similar to those originally used to
define the Johnson-Cousins system (dashed-line; B-band:
Azusienis & Straizys
1969;
R-band:
Bessell 1990).
It is worth noting that our
filters as plotted have been convolved with the spectral response
functions of the corresponding detectors. This could be, in part, the
reason for the apparently-poorer spectral response of our filters to
wavelengths longer than ~ 6500Å compared to those used by
Landolt (1992a) and
Bessell (1990).
Narrow-band filters used at
Palomar and Las Campanas were 20Å and 65Å wide,
respectively. The use of narrower
H filters at Palomar
Observatory reduced the contribution of the continuum to the photon
noise of the H images,
partially compensating for both the poorer image quality of the
H images obtained at Palomar
Observatory and the smaller collecting area of the 60-inch telescope.
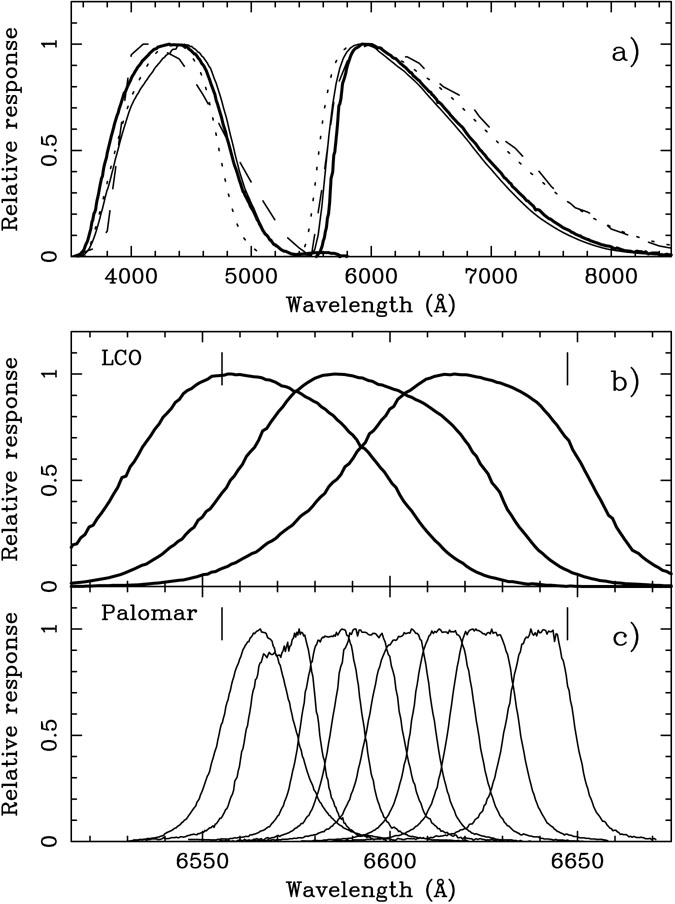 |
Figure 2. a) Spectral response
function of the B and R
broad-band filters used at the Palomar Observatory 60-inch telescope
(solid-thin line) and at the Las Campanas Observatory du Pont 100-inch
telescope (solid-thick line) convolved with the quantum efficiency of
the detector. The response function of the filters used by Landolt
(1992a;
dotted-line) to construct his list of secondary standards and
those originally used to define the Johnson-Cousins system
(dashed-line; B-band:
Azusienis & Straizys
1969;
R-band:
Bessell 1990).
b) Spectral response function of the narrow-band
H |